IBOV 185,229.17 ▼ 0.41% IPSA 11,381.18 ▲ 1.30% IPC MEX 63,375.93 ▼ 0.78% MERVAL 3,021,926 ▼ 1.29% COLCAP 2,548.22 ▲ 1.05% BVL PERÚ 60,023.65 ▼ 1.13% USD/BRL5.14▲ 0.06% USD/MXN17.23▼ 0.02% USD/CLP959.00▼ 0.31% USD/COP3,176▲ 0.05% USD/PEN3.37▼ 0.07% USD/ARS1,514▼ 0.03% USD/UYU40.16▲ 2.99% USD/PYG5,906▲ 3.00% USD/BOB9.95▲ 1.26% USD/DOP58.83▲ 2.40% USD/CRC444.45▲ 2.50% USD/GTQ7.63▲ 3.11% USD/HNL26.85▲ 3.16% USD/NIO36.62— 0.00% USD/VES847.44▼ 0.13% USD/PAB1.00— 0.00% USD/BZD2.00— 0.00% USD/JMD 157.28 — 0.00% USD/TTD6.75▲ 2.45% EUR/BRL5.91▲ 0.53% BRENT 88.88 ▼ 0.03% WTI 83.11 ▼ 0.11% IRON ORE 161.91 — — COPPER 6.61 ▲ 0.03% GOLD 4,461 ▲ 1.78% SILVER 65.59 ▲ 1.26% SOY 1,184 ▲ 3.20% CORN 480.50 ▲ 10.02% WHEAT 655.00 ▲ 3.93% COFFEE 317.25 ▼ 5.51% SUGAR 16.43 ▼ 1.79% ORANGE JUICE 138.55 ▼ 0.47% COTTON 85.03 ▲ 2.33% COCOA 5,719 ▲ 3.18% BEEF 223.60 ▼ 3.93% CATTLE 339.10 ▼ 3.16% LITHIUM 75.20 ▲ 1.47% PETR4 41.64 ▼ 0.05% VALE3 72.97 ▲ 0.83% ITUB4 38.60 ▼ 1.03% BBDC4 16.85 ▲ 0.36% ABEV3 14.89 ▼ 0.80% BBAS3 19.37 ▲ 0.47% B3SA3 14.26 ▼ 0.21% WEGE3 47.59 ▲ 0.49% PRIO3 59.14 ▼ 0.19% SUZB3 41.33 ▲ 2.35% RENT3 34.68 ▼ 0.09% AZZA3 15.89 ▼ 2.63% CSAN3 3.22 ▼ 1.83% RAIZ4 0.25 — 0.00% PCAR3 2.75 ▼ 0.36% GMAT3 3.65 ▼ 1.08% PSSA3 48.13 ▼ 0.54% CVCB3 1.33 ▼ 2.92% POSI3 3.36 ▲ 2.44% SLCE3 13.34 ▲ 0.30% NATU3 8.14 ▼ 0.73% IBOV 185,229.17 ▼ 0.41% IPSA 11,381.18 ▲ 1.30% IPC MEX 63,375.93 ▼ 0.78% MERVAL 3,021,926 ▼ 1.29% COLCAP 2,548.22 ▲ 1.05% BVL PERÚ 60,023.65 ▼ 1.13% USD/BRL 5.16 ▲ 0.01% USD/MXN 17.06 ▼ 0.24% USD/CLP 913.98 ▲ 0.04% USD/COP 3,140 ▲ 0.03% USD/PEN 3.36 ▼ 0.66% USD/ARS 1,493 ▲ 0.10% USD/UYU 40.27 ▲ 1.24% USD/PYG 5,939 ▲ 1.68% USD/BOB 11.64 ▼ 0.76% USD/DOP 58.34 ▲ 1.25% USD/CRC 445.92 ▲ 0.89% USD/GTQ 7.62 ▲ 2.21% USD/HNL 26.79 ▲ 1.57% USD/NIO 36.62 ▲ 0.69% USD/VES 762.44 ▼ 0.13% USD/PAB 1.00 — 0.00% USD/BZD 2.00 — 0.00% USD/JMD 157.28 — 0.00% USD/TTD 6.70 ▲ 0.61% EUR/BRL 5.95 ▲ 1.01% BRENT 88.88 ▼ 0.03% WTI 83.11 ▼ 0.11% IRON ORE 161.91 — — COPPER 6.61 ▲ 0.03% GOLD 4,461 ▲ 1.78% SILVER 65.59 ▲ 1.26% SOY 1,184 ▲ 3.20% CORN 480.50 ▲ 10.02% WHEAT 655.00 ▲ 3.93% COFFEE 317.25 ▼ 5.51% SUGAR 16.43 ▼ 1.79% ORANGE JUICE 138.55 ▼ 0.47% COTTON 85.03 ▲ 2.33% COCOA 5,719 ▲ 3.18% BEEF 223.60 ▼ 3.93% CATTLE 339.10 ▼ 3.16% LITHIUM 75.20 ▲ 1.47% PETR4 41.64 ▼ 0.05% VALE3 72.97 ▲ 0.83% ITUB4 38.60 ▼ 1.03% BBDC4 16.85 ▲ 0.36% ABEV3 14.89 ▼ 0.80% BBAS3 19.37 ▲ 0.47% B3SA3 14.26 ▼ 0.21% WEGE3 47.59 ▲ 0.49% PRIO3 59.14 ▼ 0.19% SUZB3 41.33 ▲ 2.35% RENT3 34.68 ▼ 0.09% AZZA3 15.89 ▼ 2.63% CSAN3 3.22 ▼ 1.83% RAIZ4 0.25 — 0.00% PCAR3 2.75 ▼ 0.36% GMAT3 3.65 ▼ 1.08% PSSA3 48.13 ▼ 0.54% CVCB3 1.33 ▼ 2.92% POSI3 3.36 ▲ 2.44% SLCE3 13.34 ▲ 0.30% NATU3 8.14 ▼ 0.73%
since 2009
Monday, September 21, 2026

World-News China

China’s Car Export Growth Faces New Trade Realities

By · April 22, 2025 · 2 min read

The LatAm Brief

One email, every weekday morning. What moved in Latin American markets, politics and expat life.

Yesterday’s subject line: “Bolivia's 83% fuel shock, hours after the IMF loan”

Free. We send a confirmation link first — nothing arrives until you click it. Unsubscribe with one click in any edition. If you stop opening us for 30 days we stop sending by ourselves, as we assume the interest is no longer there. See our privacy policy. We never share your email.

China’s auto industry posted a 16% increase in vehicle exports in the first quarter of 2025, shipping 1.54 million units abroad, according to the China Passenger Car Association. This growth signals China’s continued push to expand its automotive reach, even as global trade winds shift.

Chinese automakers found their strongest overseas demand in Mexico, the United Arab Emirates, Russia, Saudi Arabia, Belgium, Australia, Brazil, the United Kingdom, the Philippines, and Turkey.

Mexico alone imported over 138,000 Chinese vehicles in the first three months of 2025. The United Arab Emirates and Russia followed with more than 100,000 and 99,000 units, respectively.

These figures highlight China’s strategic focus on emerging markets, especially as trade barriers rise in the US and Europe. New energy vehicles (NEVs)—including electric and hybrid models—drove much of this export momentum.

NEV exports soared 43.9% year-on-year, totaling 441,000 units in the first quarter. Chery and BYD led the way. Chery exported 254,000 vehicles, holding 17.9% of the export market. BYD shipped 214,000 units, more than doubling its exports from the previous year.
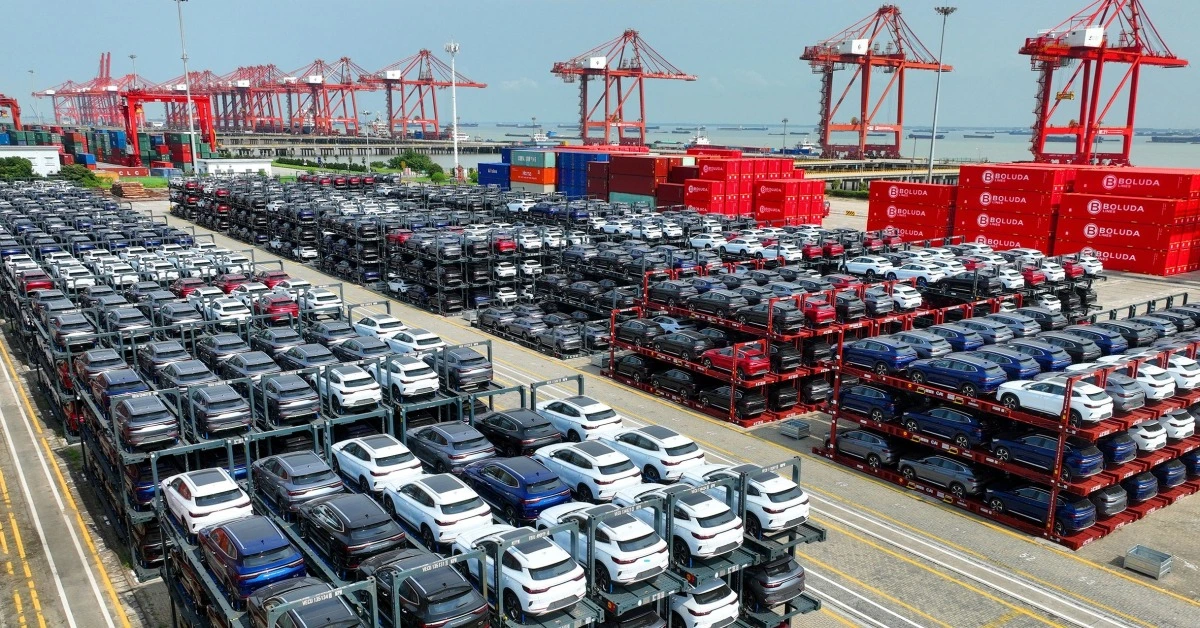
China’s Car Export Growth Faces New Trade Realities
China’s Car Export Growth Faces New Trade Realities.
One-stop reference
Company Intelligence
Every listed company in Latin America — financials, ownership and structure for 1,450+ companies across 26 exchanges, in one place.
Browse the directory →
RT
Ask Rio Times
17 years of Latin America reporting, on demand.
Open the full Ask Rio Times →

China’s domestic market also expanded. In March 2025, automakers produced 3.01 million vehicles and sold 2.92 million, up 11.9% and 8.2% year-on-year, respectively.

However, sales of traditional fuel vehicles dropped 5.4% in the first quarter, while NEVs continued to rise. Trade tensions now shape the industry’s outlook.

Tariffs Disrupt Auto Trade as China Shifts Strategy

The United States and China imposed new tariffs in April 2025, which immediately impacted cross-border car flows. Ford, for example, halted exports of US-made vehicles to China as tariffs reached 150%.

China responded by warning it would retaliate against countries aligning with US trade restrictions. Industry forecasts suggest China’s vehicle export growth will slow to 5.8% in 2025, down from nearly 20% last year.

Analysts attribute this to rising tariffs and shifting global demand. Chinese automakers now pivot toward hybrid vehicles and emerging markets to avoid the brunt of Western trade barriers.

Despite these challenges, China’s automakers continue to invest in technology. Smart cockpit features now appear in 73% of new Chinese vehicles, outpacing the global average.

The sector’s ability to adapt to new trade realities and consumer preferences will determine its next phase of growth.

This article was produced by The Rio Times’ automated newsroom system. How we use AI · Report an error

Read More from The Rio Times

The Rio Times · Power Map
See who really holds power in Latin America
Click to open the Power Map

Rotate for Best Experience

This report is optimized for landscape viewing. Rotate your phone for the full experience.