IBOV 185,899.93 ▼ 0.37% IPSA 11,410.19 ▲ 0.46% IPC MEX 63,536.96 ▲ 0.25% MERVAL 2,990,605 ▼ 0.28% COLCAP 2,570.03 ▲ 0.17% BVL PERÚ 59,529.36 ▲ 0.20% USD/BRL5.11▼ 0.01% USD/MXN17.29▲ 0.41% USD/CLP947.01▼ 0.23% USD/COP3,203▲ 0.85% USD/PEN3.36▼ 0.42% USD/ARS1,514▼ 0.02% USD/UYU40.06▲ 2.88% USD/PYG5,918▲ 3.14% USD/BOB11.85▲ 25.24% USD/DOP59.00▲ 3.23% USD/CRC445.27▲ 2.84% USD/GTQ7.63▲ 3.24% USD/HNL26.86▲ 3.32% USD/NIO36.62▲ 2.80% USD/VES850.29▼ 0.13% USD/PAB1.00— 0.00% USD/BZD2.00— 0.00% USD/JMD 157.28 — 0.00% USD/TTD6.74▲ 2.48% EUR/BRL5.85▼ 0.85% BRENT 88.88 ▼ 0.03% WTI 83.11 ▼ 0.11% IRON ORE 161.91 — — COPPER 6.61 ▲ 0.03% GOLD 4,461 ▲ 1.78% SILVER 65.59 ▲ 1.26% SOY 1,184 ▲ 3.20% CORN 480.50 ▲ 10.02% WHEAT 655.00 ▲ 3.93% COFFEE 317.25 ▼ 5.51% SUGAR 16.43 ▼ 1.79% ORANGE JUICE 138.55 ▼ 0.47% COTTON 85.03 ▲ 2.33% COCOA 5,719 ▲ 3.18% BEEF 223.60 ▼ 3.93% CATTLE 339.10 ▼ 3.16% LITHIUM 75.20 ▲ 1.47% PETR4 41.64 ▼ 0.05% VALE3 72.97 ▲ 0.83% ITUB4 38.60 ▼ 1.03% BBDC4 16.85 ▲ 0.36% ABEV3 14.89 ▼ 0.80% BBAS3 19.37 ▲ 0.47% B3SA3 14.26 ▼ 0.21% WEGE3 47.59 ▲ 0.49% PRIO3 59.14 ▼ 0.19% SUZB3 41.33 ▲ 2.35% RENT3 34.68 ▼ 0.09% AZZA3 15.89 ▼ 2.63% CSAN3 3.22 ▼ 1.83% RAIZ4 0.25 — 0.00% PCAR3 2.75 ▼ 0.36% GMAT3 3.65 ▼ 1.08% PSSA3 48.13 ▼ 0.54% CVCB3 1.33 ▼ 2.92% POSI3 3.36 ▲ 2.44% SLCE3 13.34 ▲ 0.30% NATU3 8.14 ▼ 0.73% IBOV 185,899.93 ▼ 0.37% IPSA 11,410.19 ▲ 0.46% IPC MEX 63,536.96 ▲ 0.25% MERVAL 2,990,605 ▼ 0.28% COLCAP 2,570.03 ▲ 0.17% BVL PERÚ 59,529.36 ▲ 0.20% USD/BRL 5.16 ▲ 0.01% USD/MXN 17.06 ▼ 0.24% USD/CLP 913.98 ▲ 0.04% USD/COP 3,140 ▲ 0.03% USD/PEN 3.36 ▼ 0.66% USD/ARS 1,493 ▲ 0.10% USD/UYU 40.27 ▲ 1.24% USD/PYG 5,939 ▲ 1.68% USD/BOB 11.64 ▼ 0.76% USD/DOP 58.34 ▲ 1.25% USD/CRC 445.92 ▲ 0.89% USD/GTQ 7.62 ▲ 2.21% USD/HNL 26.79 ▲ 1.57% USD/NIO 36.62 ▲ 0.69% USD/VES 762.44 ▼ 0.13% USD/PAB 1.00 — 0.00% USD/BZD 2.00 — 0.00% USD/JMD 157.28 — 0.00% USD/TTD 6.70 ▲ 0.61% EUR/BRL 5.95 ▲ 1.01% BRENT 88.88 ▼ 0.03% WTI 83.11 ▼ 0.11% IRON ORE 161.91 — — COPPER 6.61 ▲ 0.03% GOLD 4,461 ▲ 1.78% SILVER 65.59 ▲ 1.26% SOY 1,184 ▲ 3.20% CORN 480.50 ▲ 10.02% WHEAT 655.00 ▲ 3.93% COFFEE 317.25 ▼ 5.51% SUGAR 16.43 ▼ 1.79% ORANGE JUICE 138.55 ▼ 0.47% COTTON 85.03 ▲ 2.33% COCOA 5,719 ▲ 3.18% BEEF 223.60 ▼ 3.93% CATTLE 339.10 ▼ 3.16% LITHIUM 75.20 ▲ 1.47% PETR4 41.64 ▼ 0.05% VALE3 72.97 ▲ 0.83% ITUB4 38.60 ▼ 1.03% BBDC4 16.85 ▲ 0.36% ABEV3 14.89 ▼ 0.80% BBAS3 19.37 ▲ 0.47% B3SA3 14.26 ▼ 0.21% WEGE3 47.59 ▲ 0.49% PRIO3 59.14 ▼ 0.19% SUZB3 41.33 ▲ 2.35% RENT3 34.68 ▼ 0.09% AZZA3 15.89 ▼ 2.63% CSAN3 3.22 ▼ 1.83% RAIZ4 0.25 — 0.00% PCAR3 2.75 ▼ 0.36% GMAT3 3.65 ▼ 1.08% PSSA3 48.13 ▼ 0.54% CVCB3 1.33 ▼ 2.92% POSI3 3.36 ▲ 2.44% SLCE3 13.34 ▲ 0.30% NATU3 8.14 ▼ 0.73%
since 2009
Tuesday, September 22, 2026

Chile’s Income Landscape in 2023: A Closer Look at the Wage Gap and Regional Disparities

By · August 26, 2024 · 2 min read

The LatAm Brief

One email, every weekday morning. What moved in Latin American markets, politics and expat life.

Yesterday’s subject line: “68 strikes, 223 people. A UN expert says murder.”

Free. We send a confirmation link first — nothing arrives until you click it. Unsubscribe with one click in any edition. If you stop opening us for 30 days we stop sending by ourselves, as we assume the interest is no longer there. See our privacy policy. We never share your email.

Recently, Chile’s National Institute of Statistics reported on wage distribution. This data revealed key insights into the economy.

The Supplementary Income Survey (ESI) provided this information. They conducted the survey between October and December 2022.

The average monthly net income was 826,535 CLP ($909). However, significant disparities exist based on gender, sector, and region.

The survey highlighted a pronounced gender wage gap. Men earned 919,574 CLP ($1,012) monthly on average.

In contrast, women earned only 704,953 CLP ($776). This reflects a 23.3% income disparity among women. Consequently, challenges in achieving gender pay equity persist in Chile.
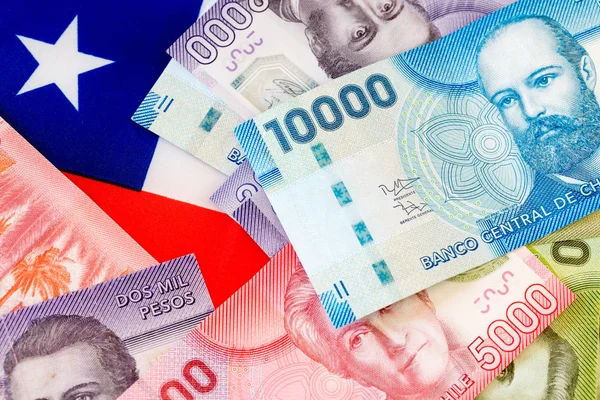
Chile's Income Landscape in 2023: A Closer Look at the Wage Gap and Regional Disparities
Chile’s Income Landscape in 2023: A Closer Look at the Wage Gap and Regional Disparities.
One-stop reference
Company Intelligence
Every listed company in Latin America — financials, ownership and structure for 1,450+ companies across 26 exchanges, in one place.
Browse the directory →
RT
Ask Rio Times
17 years of Latin America reporting, on demand.
Open the full Ask Rio Times →

Public Sector Leads in Wages

Public sector employees earned the most. Their average monthly income was 1,144,591 CLP ($1,259). Private sector employees earned 881,029 CLP ($969) on average.

Self-employed workers earned significantly less, averaging 459,927 CLP ($506). Employers reported the highest average income at 1,397,101 CLP ($1,537).

Regional Income Disparities

Income levels varied significantly across Chile. Antofagasta recorded the highest average income at 1,085,860 CLP ($1,195). Magallanes followed with 958,568 CLP ($1,055).

The Metropolitan Region reported 948,658 CLP ($1,044). These figures exceed the national average of 826,535 CLP ($909).

Median incomes highlighted regional differences. Antofagasta had a median income of 704,141 CLP ($775).

Aysén reported 619,482 CLP ($682). Atacama’s median income was 600,000 CLP ($660). Regional economic conditions heavily influence wage levels.

Income Distribution: A Closer Look

The ESI detailed income distribution across the population. A significant portion, 16.8%, earned between 400,000 CLP ($440) and 500,000 CLP ($550).

Meanwhile, 12.2% earned between 500,000 CLP ($550) and 600,000 CLP ($660). Additionally, 8.7% fell into the 600,000 CLP ($660) to 700,000 CLP ($770) bracket.

Notably, 23.6% earned 1 million CLP ($1,100) or more. Only 2% earned 3 million CLP ($3,301) or more.

Why It Matters

This data paints a comprehensive picture of the income distribution in Chile. It highlights crucial issues, like the gender wage gap. Regional economic disparities also stand out.

Policymakers must understand these patterns. They aim to address inequality and promote economic fairness. Chile continues to navigate economic challenges.

In short, these figures will shape future policies and initiatives. They aim to foster a more equitable society.

This article was produced by The Rio Times’ automated newsroom system. How we use AI · Report an error

Read More from The Rio Times

The Rio Times · Power Map
See who really holds power in Latin America
Click to open the Power Map

Rotate for Best Experience

This report is optimized for landscape viewing. Rotate your phone for the full experience.