IBOV 185,147.15 ▼ 0.02% IPSA 11,315.26 ▼ 1.14% IPC MEX 64,866.61 ▼ 0.87% MERVAL 3,049,121 ▼ 0.29% COLCAP 2,544.56 ▲ 0.40% BVL PERÚ 59,978.22 ▼ 0.31% USD/BRL5.12▼ 0.03% USD/MXN16.90▲ 0.10% USD/CLP933.68— 0.00% USD/COP3,124▼ 1.12% USD/PEN3.35▼ 0.34% USD/ARS1,509▲ 0.01% USD/UYU40.24▲ 1.33% USD/PYG5,947▲ 1.88% USD/BOB12.40▲ 3.56% USD/DOP59.00▲ 0.85% USD/CRC448.67▲ 1.78% USD/GTQ7.63▲ 2.28% USD/HNL26.84▲ 0.28% USD/NIO36.62— 0.00% USD/VES805.37▼ 0.90% USD/PAB1.00— 0.00% USD/BZD2.00— 0.00% USD/JMD 157.28 — 0.00% USD/TTD6.71▲ 1.02% EUR/BRL5.95▲ 0.91% BRENT 88.88 ▼ 0.03% WTI 83.11 ▼ 0.11% IRON ORE 161.91 — — COPPER 6.61 ▲ 0.03% GOLD 4,461 ▲ 1.78% SILVER 65.59 ▲ 1.26% SOY 1,184 ▲ 3.20% CORN 480.50 ▲ 10.02% WHEAT 655.00 ▲ 3.93% COFFEE 317.25 ▼ 5.51% SUGAR 16.43 ▼ 1.79% ORANGE JUICE 138.55 ▼ 0.47% COTTON 85.03 ▲ 2.33% COCOA 5,719 ▲ 3.18% BEEF 223.60 ▼ 3.93% CATTLE 339.10 ▼ 3.16% LITHIUM 75.20 ▲ 1.47% PETR4 41.64 ▼ 0.05% VALE3 72.97 ▲ 0.83% ITUB4 38.60 ▼ 1.03% BBDC4 16.85 ▲ 0.36% ABEV3 14.89 ▼ 0.80% BBAS3 19.37 ▲ 0.47% B3SA3 14.26 ▼ 0.21% WEGE3 47.59 ▲ 0.49% PRIO3 59.14 ▼ 0.19% SUZB3 41.33 ▲ 2.35% RENT3 34.68 ▼ 0.09% AZZA3 15.89 ▼ 2.63% CSAN3 3.22 ▼ 1.83% RAIZ4 0.25 — 0.00% PCAR3 2.75 ▼ 0.36% GMAT3 3.65 ▼ 1.08% PSSA3 48.13 ▼ 0.54% CVCB3 1.33 ▼ 2.92% POSI3 3.36 ▲ 2.44% SLCE3 13.34 ▲ 0.30% NATU3 8.14 ▼ 0.73% IBOV 185,147.15 ▼ 0.02% IPSA 11,315.26 ▼ 1.14% IPC MEX 64,866.61 ▼ 0.87% MERVAL 3,049,121 ▼ 0.29% COLCAP 2,544.56 ▲ 0.40% BVL PERÚ 59,978.22 ▼ 0.31% USD/BRL 5.16 ▲ 0.01% USD/MXN 17.06 ▼ 0.24% USD/CLP 913.98 ▲ 0.04% USD/COP 3,140 ▲ 0.03% USD/PEN 3.36 ▼ 0.66% USD/ARS 1,493 ▲ 0.10% USD/UYU 40.27 ▲ 1.24% USD/PYG 5,939 ▲ 1.68% USD/BOB 11.64 ▼ 0.76% USD/DOP 58.34 ▲ 1.25% USD/CRC 445.92 ▲ 0.89% USD/GTQ 7.62 ▲ 2.21% USD/HNL 26.79 ▲ 1.57% USD/NIO 36.62 ▲ 0.69% USD/VES 762.44 ▼ 0.13% USD/PAB 1.00 — 0.00% USD/BZD 2.00 — 0.00% USD/JMD 157.28 — 0.00% USD/TTD 6.70 ▲ 0.61% EUR/BRL 5.95 ▲ 1.01% BRENT 88.88 ▼ 0.03% WTI 83.11 ▼ 0.11% IRON ORE 161.91 — — COPPER 6.61 ▲ 0.03% GOLD 4,461 ▲ 1.78% SILVER 65.59 ▲ 1.26% SOY 1,184 ▲ 3.20% CORN 480.50 ▲ 10.02% WHEAT 655.00 ▲ 3.93% COFFEE 317.25 ▼ 5.51% SUGAR 16.43 ▼ 1.79% ORANGE JUICE 138.55 ▼ 0.47% COTTON 85.03 ▲ 2.33% COCOA 5,719 ▲ 3.18% BEEF 223.60 ▼ 3.93% CATTLE 339.10 ▼ 3.16% LITHIUM 75.20 ▲ 1.47% PETR4 41.64 ▼ 0.05% VALE3 72.97 ▲ 0.83% ITUB4 38.60 ▼ 1.03% BBDC4 16.85 ▲ 0.36% ABEV3 14.89 ▼ 0.80% BBAS3 19.37 ▲ 0.47% B3SA3 14.26 ▼ 0.21% WEGE3 47.59 ▲ 0.49% PRIO3 59.14 ▼ 0.19% SUZB3 41.33 ▲ 2.35% RENT3 34.68 ▼ 0.09% AZZA3 15.89 ▼ 2.63% CSAN3 3.22 ▼ 1.83% RAIZ4 0.25 — 0.00% PCAR3 2.75 ▼ 0.36% GMAT3 3.65 ▼ 1.08% PSSA3 48.13 ▼ 0.54% CVCB3 1.33 ▼ 2.92% POSI3 3.36 ▲ 2.44% SLCE3 13.34 ▲ 0.30% NATU3 8.14 ▼ 0.73%
since 2009
Sunday, September 6, 2026

Brazil Business - Brazil

Brazil’s Oil and Gas Production Sees Significant Growth in June 2024

By · August 2, 2024 · 2 min read

Daily Brief

The morning intel from across Latin America. Free.

By subscribing you agree to our privacy policy. We never share your email.

In June 2024, Brazil’s oil production reached 3.409 million barrels per day (bbl/d). This marked a 2.7% increase from the previous month, according to the Agência Nacional do Petróleo, Gás Natural e Biocombustíveis (ANP).

The country’s natural gas production also rose, reaching 150.07 million cubic meters per day (m2/d), a 3.1% increase compared to May.

This resulted in a combined oil and natural gas production of 4.353 million barrels of oil equivalent per day (boe/d) for June.

A significant portion of Brazil’s oil and gas production comes from pre-salt fields. These are deep-water reserves located off the Brazilian coast.

In June, pre-salt production amounted to 3.424 million boe/d, accounting for 78.7% of the country’s total production.
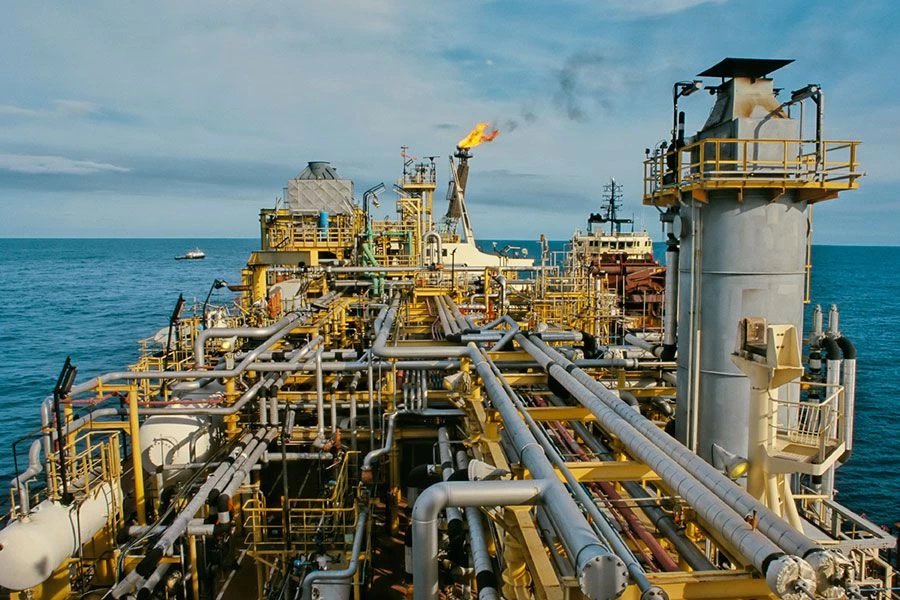
Brazil's Oil and Gas Production: Trends and Implications
Brazil’s Oil and Gas Production: Trends and Implications.
One-stop reference
Company Intelligence
Every listed company in Latin America — financials, ownership and structure for 1,450+ companies across 26 exchanges, in one place.
Browse the directory →
RT
Ask Rio Times
Latin American markets, currencies and companies.
Open the full Ask Rio Times →

This represents a 3.3% increase from the previous month and a 5.6% increase compared to June 2023.

The Tupi field in the Santos Basin was the largest producer, with 787.08 thousand bbl/d of oil and 39.70 million m3/d of natural gas. Offshore fields produced 97.6% of Brazil’s oil and 86.8% of its natural gas in June.

Petrobras, Brazil’s state-controlled oil company, was responsible for 89.5% of the total production, either alone or in partnership with other firms.

The ANP’s data encompasses 54 companies operating in Brazil, managing 6,551 wells across 275 areas.

Brazil is the largest oil producer in Latin America, with an average output of over 3.4 million barrels per day in 2023.

Mexico follows with around 1.9 million bbl/d. Venezuela, despite having the largest crude oil reserves in the region, produced approximately 751 thousand bbl/d.

Brazil’s production is significantly higher than its regional counterparts, underscoring its leading role in the Latin American oil market.

Brazil’s Oil Production and Ambitious Future Goals

Globally, Brazil ranks as the seventh-largest oil producer, which accounts for 4% of the world’s total oil production.

The country aims to expand its production further, potentially becoming one of the top five oil exporters worldwide.

Brazil’s energy ministry has set an ambitious target to achieve a production of 5.4 million bpd by 2029. This would represent an 80% increase from its 2022 production levels.

Pre-salt fields will contribute nearly 80% of this output. The plan also includes significant investments in oil and gas exploration and production, estimated to range between $428 billion and $474 billion.

Brazil’s oil and gas sector continues to grow, driven by substantial offshore production and significant contributions from pre-salt fields.

While the country is making strides in clean energy, it remains committed to fossil fuel exploration. This supports its energy transition and economic goals.

This dual approach positions Brazil uniquely in the global energy landscape, balancing traditional energy sources with renewable initiatives.

This article was produced by The Rio Times’ automated newsroom system. How we use AI · Report an error

Read More from The Rio Times

The Rio Times · Power Map
See who really holds power in Latin America
Click to open the Power Map

Rotate for Best Experience

This report is optimized for landscape viewing. Rotate your phone for the full experience.