Brazil’s exports are among those that dropped the most in third quarter – OECD
RIO DE JANEIRO, BRAZIL – Brazil had the second-largest drop in exports of goods among the G20 countries in the third quarter compared to the previous quarter, according to a survey by the Organization for Economic Cooperation and Development (OECD).
The exports of goods from the world’s largest economies grew 0.9%, and imports, 0.4%, in the third quarter, measured in US dollars. In the case of Brazil, exports suffered a 7.1% contraction but came from a record high of 29.8% in the previous quarter.
Only South Africa had a more significant drop in exports between July and September in the G20. The country’s sales shrank by 15.3%.
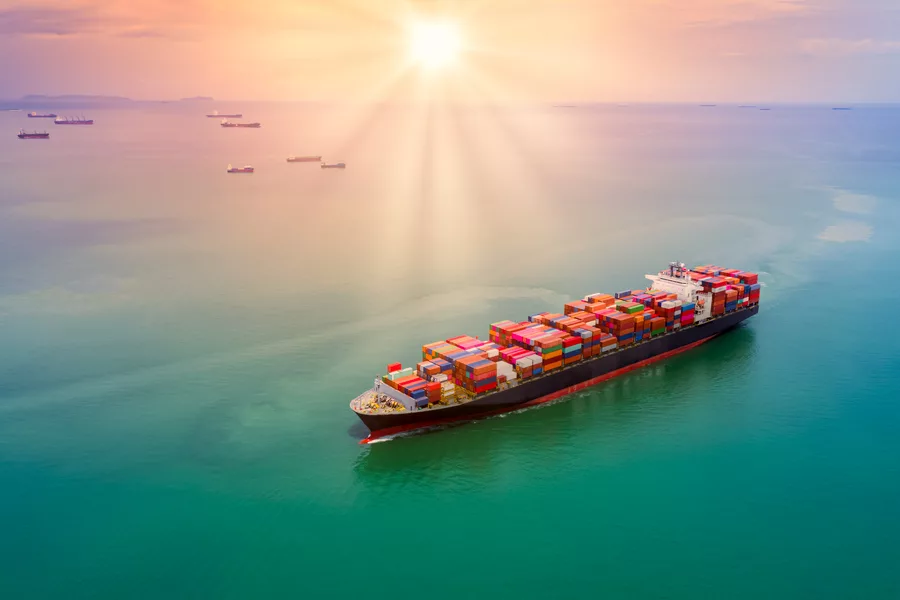
In the case of imports, they fell 1.5% in Brazil and 2.7% in South Africa. And its main client, China, also imported 6.2% less in the third quarter.
Brazil exported US$4.4 billion less in the third quarter in relation to the second quarter. But sales were US$20.8 billion higher than the third quarter of last year, at the height of the covid-19 pandemic.
As services picked up, international trade continued to expand in the G20 in Q3 2021, but growth in merchandise trade slowed.
According to the OECD, international merchandise trade in the G20 stabilized at a record level after four quarters of sustained growth in the third quarter. There was a marked slowdown from the first half of the year when rising prices boosted the value of goods traded.
Sustained demand for electronics and high energy prices continued to play a role in the third quarter, while overstretched semiconductor supply chains weighed on trade-in vehicles and parts.
Thus, electronics (integrated circuits, cell phones, displays, and computers) continued to drive the East Asian merchandise trade in the third quarter. Korean exports and imports increased by 5.6% and 4.6%, respectively, with exports of electric and hybrid cars at a record level despite the overall weak trend for vehicles and parts.
Exports also expanded in China (up 1.6%), while imports declined by 6.2% after double-digit growth in the first half of the year. Japanese imports increased by 3.9%, led mainly by energy and pharmaceutical products, while exports declined by 0.3% due to lower vehicle shipments.
Despite falling prices in September, minerals and metal ores drove Australia’s merchandise export growth (3.6%). Imports, meanwhile, fell 5.5% as lockdowns in eastern Australia depressed demand for fuel and energy products. India and Indonesia recorded solid export growth (7.0% and 6.5%, respectively).
In Europe, merchandise trade fell in the third quarter compared to the previous quarter. Exports contracted by 0.5 percent in the European Union, with the drop in shipments of machinery and vehicles affecting Germany in particular (down 1.9 percent) and Italy (down 1.5 percent).
French exports, on the other hand, registered a slight increase (1.0%). Except for Germany (down 2.2%), merchandise imports increased moderately across the region (up 0.4% for the EU as a whole, 2.0% for Italy, and 1.7% for France).
In the US, merchandise exports and imports increased by 1.0% and 1.5%. Canadian exports grew by 1.7% despite lower lumber prices weighing on forest products exports. Mexican exports remained flat (down 0.2%), while imports expanded by 4.4%.
Grains drove the increase in Argentina’s merchandise exports (up 13.7%), while Brazilian exports and imports contracted by 7.1% and 1.5%, respectively, in Q3 2021, following double-digit growth in Q2.
Growth in service exports and imports for the G20 is estimated at 5.1% and 5.8% in Q3 2021, respectively, compared to the previous quarter and measured in seasonally adjusted US dollars.
More: Brazil news in English, every day from The Rio Times.
This article was produced by The Rio Times’ automated newsroom system. How we use AI · Report an error · Editorial responsibility: Matthias Camenzind, Editor-in-Chief
Brazil runoff, Sunday, October 25: Brazil runoff: date, poll closing times and when results start. Latest: Brazil runoff polls, Flávio 51%, Lula 49%.