Brazil Agribusiness Posts Record Exports as China Buys 35% of Sales
Economy · Brazil
—The stakes. Brazil agribusiness is a top or leading global supplier across soy, beef, poultry, coffee, sugar, corn and orange juice, anchoring the country’s trade surplus.
Runoff · Sunday, 25 October
Brazil Runoff 2026: Lula vs Flávio
Date, polls, debates, odds and how the runoff works, updated every day.
Read our Brazil election 2026 runoff guide →
Brazil runoff polls · Polymarket and Kalshi odds · When results come · Brazil election poll data (CSV)
Prediction markets · who wins the runoff
Implied chance of winning Brazil’s presidency on 25 October, from traders’ prices.
Polymarket
Flávio Bolsonaro 80.2% · Lula 19.5% (US$194 million traded)
Kalshi (regulated in the US by the CFTC)
Flávio Bolsonaro 80% · Lula 22%
As of 24 October, 8:00 am ET (13:00 Lisbon), updated every 20 minutes. Prices are bets, not polls, and can move fast.
Why we show this: prediction markets turn real-money bets into a live probability that moves within minutes of the news, which is why investors, campaigns and newsrooms in the United States now follow them closely. We show them next to polls and official results, never instead of them.
—The record. CONAB projected the 2025/26 grain crop at 360.8 million tons in its August 2026 survey, a new record and 2.4% above the prior season.
—The China link. China took 35% of first-half 2026 Brazilian agribusiness export revenue, on Cepea figures published this week, with US$30 billion or more in purchases and 66% of that value in the soy complex.
—The export value. Brazilian beef exports reached a record US$18.03 billion in 2025, up 40.1% from the prior year, while agribusiness exports to China hit US$55.3 billion in 2025.
The direction for 2026 is the other way. The US Department of Agriculture forecasts Brazilian beef production down about 2% and exports down about 5% this year, on cattle-cycle reversion and Chinese safeguard measures.
—The GDP weight. Brazilian agriculture grew 2.8% quarter on quarter and 6.8% year on year in the second quarter of 2026, driven by soy, coffee and livestock.
Brazil agribusiness has built a scale advantage that few tropical countries can match, turning the cerrado into a grain powerhouse while keeping a dominant position in animal protein and juice. The 2025/26 season is extending that record run, though the sector’s heavy reliance on China leaves export revenue exposed to any trade realignment.
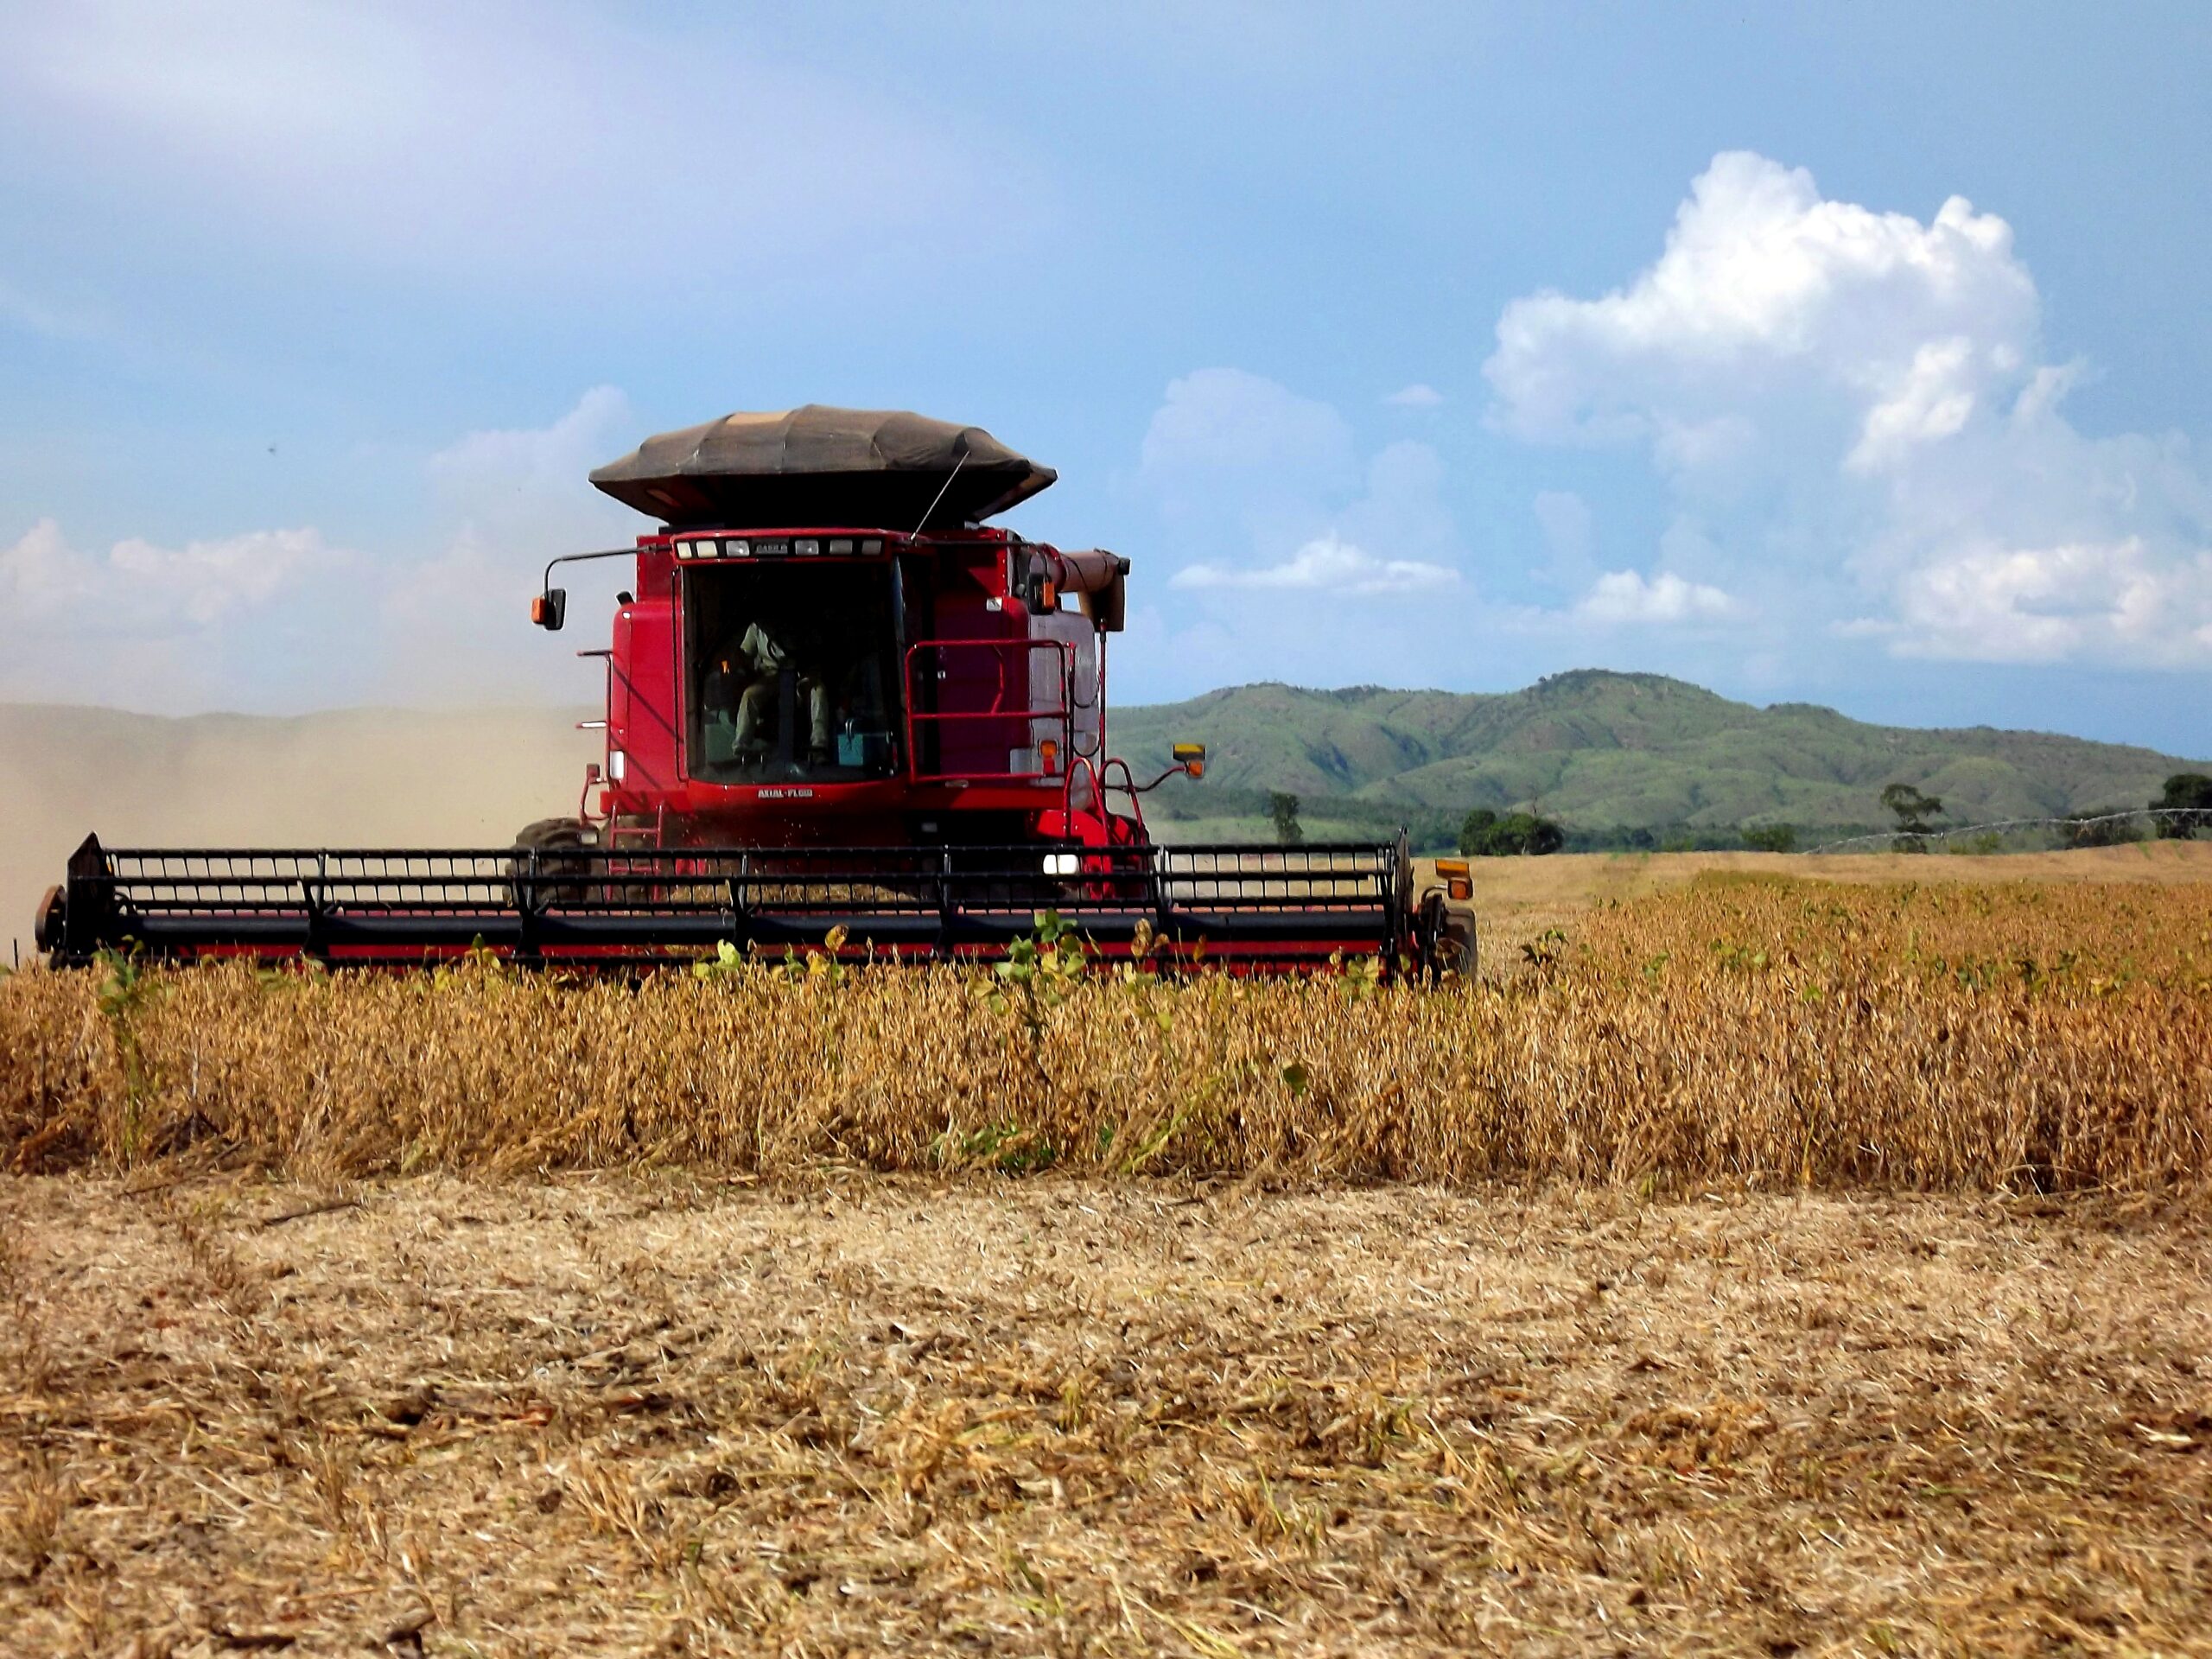
A Supply Base Across Every Major Commodity
Brazil is a major producer across soybeans, coffee, oranges, sugar, beef and orange juice. USDA Foreign Agricultural Service data for market year 2025/2026 list beef at 12.61 million metric tons and sugar at 44.39 million metric tons.
Orange juice output is estimated at 1.03 million metric tons, reinforcing Brazil’s role as the dominant global supplier. Coffee production is listed at 65 million 60-kilogram bags.
Soybean production is forecast at 180 million metric tons for the same market year. This breadth makes the country unusual among tropical agricultural exporters.
Brazil does not merely grow a single export crop. It operates across grains, proteins, beverages and sweeteners at a scale that shapes global prices.
The 2025/26 Harvest Keeps Raising the Ceiling
CONAB, Brazil’s national food supply and statistics agency, revised the 2025/26 soybean forecast from 176.12 million tons in January 2026 to 180.56 million tons in July. Its August 2026 update put the crop at about 180.46 million tons.
Corn estimates moved from 138.44 million tons in February 2026 to 142.96 million tons in August 2026. The second-crop corn performance is a central driver of those gains.
CONAB projected the total 2025/26 grain crop at 360.8 million tons in August 2026. That marks a new record and a 2.4% increase over the prior season.
The national statistics agency IBGE placed the 2026 grain, legume and oilseed harvest at 353 million tons in July 2026. That was up 2% from the previous year.
The Safrinha System and Cerrado Expansion
Brazil’s grain expansion depends heavily on the safrinha system, a second crop structure in which corn follows soybeans on the same land. This sequencing has multiplied output without requiring an equivalent expansion of new area.
Stronger second-crop corn results have repeatedly lifted national estimates through 2026. The system turns what was once an off-season into a core source of exportable grain.
The cerrado frontier remains the geographic base of this model. Public data in this review confirm large-scale soy and corn gains tied to that managed cropping pattern.
The combination of soy followed by safrinha corn makes Brazilian grain production more capital-intensive and more productive per field. It also makes farm cash flow dependent on completing two crops within one season.
Export Revenue and the China Concentration
Reuters reported that Brazil’s agricultural exports to China totaled US$55.3 billion in 2025. Soybeans accounted for US$34.5 billion and meat for US$9.82 billion of that amount.
A September 2026 report said China represented 35% of all first-half 2026 Brazilian agribusiness export revenue. Purchases surpassed US$30 billion, with 66% of that value tied to the soy complex.
In the first quarter of 2026, China took 29.8% of Brazilian agribusiness exports, worth US$11.33 billion. Total agribusiness exports reached US$38.1 billion in the quarter.
Reuters also noted Brazil may need to reroute farm export flows if US-China trade patterns shift. Brazil is considered structurally competitive and likely to capture demand beyond China as well.
Beef, Poultry and Meat Export Strength
ABIEC-linked reporting in 2026 stated Brazilian beef exports reached a record US$18.03 billion in 2025. Volume hit 3.50 million tons, up 20.9% year on year.
Export revenue grew even faster, rising 40.1% from the prior year. That points to firm global protein demand and Brazil’s cost advantage in animal production.
Poultry is also a major export segment, with USDA data listing Brazil among the world’s leading producers. Livestock, including birds and cattle, contributed to agriculture’s strong second-quarter GDP growth.
The meat complex gives Brazil two revenue streams from its grain base. Soy and corn feed both poultry and cattle, converting domestic grain into higher-value animal protein for export.
Coffee, Sugar and Orange Juice Scale
Coffee output of 65 million bags keeps Brazil as the world’s reference producer. IBGE reported that coffee output grew 15.1% year on year in the second quarter of 2026.
Sugar production of 44.39 million metric tons makes Brazil the largest or near-largest exporter of the sweetener. The sugar-energy complex also supplies ethanol, though this research set does not quantify that output.
Orange juice production of 1.03 million metric tons means Brazil dominates the global juice trade. A single tropical production base sets supply expectations for major beverage buyers.
Together these crops diversify Brazil’s export basket beyond grains and meat. They also make Brazilian agribusiness sensitive to beverage demand cycles and weather shocks in the citrus belt.
Technology Adoption and Management Intensity
Brazil’s broad crop base reflects decades of tropical agronomy, soil correction and mechanisation. Soybeans, corn, coffee, oranges and sugar all require distinct technical systems that Brazilian producers now operate at scale.
The safrinha system is itself a technology-and-management pattern. It requires precise planting dates, short-cycle varieties and heavy input use to succeed after the soybean harvest.
USDA production data show that Brazil supports an unusually large and diverse tropical crop base. That scale would not be possible without continuous adoption of improved seed, fertiliser and machinery.
Technology adoption does not remove climate risk. Second-quarter corn still depends on rainfall after the soy window closes, a point that Brazilian farm managers watch closely every season.
Credit Costs and Farm Financial Pressure
This verified research set does not include a current primary-source figure for farm insolvency or a national estimate of rural credit costs as of September 2026. Any specific claim on those variables requires separate official verification.
The closest usable evidence is that record harvests and trade gains are occurring alongside open uncertainty for 2026. External demand shifts, especially Chinese buying, remain the main risk channel identified in the sources.
Large-scale safrinha production carries high working capital needs. Seed, fertiliser and fuel costs are concentrated before export revenue arrives, making producers sensitive to financing conditions.
Even without a precise insolvency statistic, the structure of two-crop farming means a weather or margin shock in the second crop can quickly pressure cash flow. The sector’s strength does not eliminate that operational exposure.
Land and Deforestation Rules
This research set did not retrieve a current primary source on the Forest Code, Cerrado land-use rules or deforestation compliance as of September 2026. None of the verified facts here quantify legal reserve requirements or enforcement actions.
As a result, any standalone article claim about land and deforestation rules should be verified separately with current official sources before publication. This pillar intentionally avoids inventing a compliance statistic.
The absence of a current verified figure is itself relevant. The regulatory framework exists, but the data gathered for this article do not permit a precise description of its September 2026 status.
Sector Weight in GDP, Jobs and Trade
IBGE reported on 1 September 2026 that Brazilian agriculture in the second quarter of 2026 grew 2.8% quarter on quarter and 6.8% year on year. That made agriculture one of the main contributors to the economy in the period.
The growth was driven by soy, up 5.3%, coffee, up 15.1%, and livestock including birds and cattle. This shows the sector’s expansion is broad rather than reliant on one crop.
Agribusiness remains a central source of export revenue and rural employment, though this research set does not provide a current national jobs figure. The trade data confirm its weight in the balance of payments.
Record export values and record harvests reinforce the sector’s macroeconomic role. Foreign investors tracking Brazil treat agriculture as a core exposure to global food demand and Chinese consumption.
More: Brazil news in English, every day from The Rio Times.
The China Risk and the Rerouting Question
Brazil’s agribusiness exports remain highly concentrated in China. Reuters stated that any shift in US-China trade patterns could force Brazil to reroute farm export flows.
The concentration is most acute in the soy complex. China’s dominance in soybean buying gives it outsized influence over Brazilian farm margins.
Yet Brazil is considered structurally competitive and capable of capturing demand beyond China. The question for investors is not whether transformation is possible, but how quickly logistics can adapt.
A slowdown in Chinese buying would pressure prices and farm revenue. However, 2025 and first-half 2026 data show China has not retreated from Brazilian suppliers, even amid geopolitical tension.
Connected Coverage
Brazil’s Financial Morning Call for Tuesday, September 8, 2026
The Big Picture
Latest developments
- Bolsonaro Camp Asks Court to Bar Lula — 21 October 2026
- Mendonça to Rule on Lula Bank Records Plea — 21 October 2026
- Brazil Stocks Sit 0.4% Below Record as WEG Reports — 21 October 2026
- Helbor Board Backs Bid to Leave Stock Market — 20 October 2026
This article was produced by The Rio Times’ automated newsroom system. How we use AI · Report an error · Editorial responsibility: Matthias Camenzind, Editor-in-Chief
LatAm Markets: Live Signals → — real-time movers, turnover leaders and FX across Latin America.
Expat Guide to Brazil
What The Rio Times publishes for foreigners who live in or move to Brazil.
Start here
- Do US Citizens Need a Visa for Brazil? Yes, US$80.90 E-Visa
- Brazil Education and Healthcare Explained
- Brazil Security and Crime Explained 2026
- Brazil Rent and Power Bills After 4.58% Inflation
City guides
Rio de Janeiro, São Paulo, Florianópolis, Salvador, Belo Horizonte, Curitiba, Porto Alegre, Brasília
Coming up in Brazil
- Brazil Runoff Date and Results Time: 25 October, 4 p.m. ET 25 Oct
- Brazil Runoff Day on 25 October for Foreign Visitors 25 Oct
- Brazil Votes 25 October, Polls Close 4 p.m. Eastern 25 Oct
- Brazil Election 2026: Lula vs Flávio Runoff on 25 October 25 Oct
Understand Brazil