IBOV 185,992.03 ▲ 0.24% IPSA 11,381.18 ▲ 1.30% IPC MEX 63,873.32 ▲ 0.58% MERVAL 3,061,512 ▲ 1.08% COLCAP 2,521.85 ▲ 0.40% BVL PERÚ 58,965.05 ▲ 1.80% USD/BRL5.14▲ 0.25% USD/MXN17.16▼ 0.07% USD/CLP960.65▼ 0.14% USD/COP3,161▲ 0.92% USD/PEN3.37▼ 0.14% USD/ARS1,510▼ 0.03% USD/UYU40.20▲ 2.99% USD/PYG5,888▲ 2.63% USD/BOB9.75▼ 8.44% USD/DOP58.83▲ 0.22% USD/CRC444.45▲ 2.49% USD/GTQ7.63▲ 3.03% USD/HNL26.85▲ 0.38% USD/NIO36.62▲ 0.26% USD/VES846.42▼ 0.13% USD/PAB1.00— 0.00% USD/BZD2.00— 0.00% USD/JMD 157.28 — 0.00% USD/TTD6.74▲ 2.57% EUR/BRL5.91▲ 0.12% BRENT 88.88 ▼ 0.03% WTI 83.11 ▼ 0.11% IRON ORE 161.91 — — COPPER 6.61 ▲ 0.03% GOLD 4,461 ▲ 1.78% SILVER 65.59 ▲ 1.26% SOY 1,184 ▲ 3.20% CORN 480.50 ▲ 10.02% WHEAT 655.00 ▲ 3.93% COFFEE 317.25 ▼ 5.51% SUGAR 16.43 ▼ 1.79% ORANGE JUICE 138.55 ▼ 0.47% COTTON 85.03 ▲ 2.33% COCOA 5,719 ▲ 3.18% BEEF 223.60 ▼ 3.93% CATTLE 339.10 ▼ 3.16% LITHIUM 75.20 ▲ 1.47% PETR4 41.64 ▼ 0.05% VALE3 72.97 ▲ 0.83% ITUB4 38.60 ▼ 1.03% BBDC4 16.85 ▲ 0.36% ABEV3 14.89 ▼ 0.80% BBAS3 19.37 ▲ 0.47% B3SA3 14.26 ▼ 0.21% WEGE3 47.59 ▲ 0.49% PRIO3 59.14 ▼ 0.19% SUZB3 41.33 ▲ 2.35% RENT3 34.68 ▼ 0.09% AZZA3 15.89 ▼ 2.63% CSAN3 3.22 ▼ 1.83% RAIZ4 0.25 — 0.00% PCAR3 2.75 ▼ 0.36% GMAT3 3.65 ▼ 1.08% PSSA3 48.13 ▼ 0.54% CVCB3 1.33 ▼ 2.92% POSI3 3.36 ▲ 2.44% SLCE3 13.34 ▲ 0.30% NATU3 8.14 ▼ 0.73% IBOV 185,992.03 ▲ 0.24% IPSA 11,381.18 ▲ 1.30% IPC MEX 63,873.32 ▲ 0.58% MERVAL 3,061,512 ▲ 1.08% COLCAP 2,521.85 ▲ 0.40% BVL PERÚ 58,965.05 ▲ 1.80% USD/BRL 5.16 ▲ 0.01% USD/MXN 17.06 ▼ 0.24% USD/CLP 913.98 ▲ 0.04% USD/COP 3,140 ▲ 0.03% USD/PEN 3.36 ▼ 0.66% USD/ARS 1,493 ▲ 0.10% USD/UYU 40.27 ▲ 1.24% USD/PYG 5,939 ▲ 1.68% USD/BOB 11.64 ▼ 0.76% USD/DOP 58.34 ▲ 1.25% USD/CRC 445.92 ▲ 0.89% USD/GTQ 7.62 ▲ 2.21% USD/HNL 26.79 ▲ 1.57% USD/NIO 36.62 ▲ 0.69% USD/VES 762.44 ▼ 0.13% USD/PAB 1.00 — 0.00% USD/BZD 2.00 — 0.00% USD/JMD 157.28 — 0.00% USD/TTD 6.70 ▲ 0.61% EUR/BRL 5.95 ▲ 1.01% BRENT 88.88 ▼ 0.03% WTI 83.11 ▼ 0.11% IRON ORE 161.91 — — COPPER 6.61 ▲ 0.03% GOLD 4,461 ▲ 1.78% SILVER 65.59 ▲ 1.26% SOY 1,184 ▲ 3.20% CORN 480.50 ▲ 10.02% WHEAT 655.00 ▲ 3.93% COFFEE 317.25 ▼ 5.51% SUGAR 16.43 ▼ 1.79% ORANGE JUICE 138.55 ▼ 0.47% COTTON 85.03 ▲ 2.33% COCOA 5,719 ▲ 3.18% BEEF 223.60 ▼ 3.93% CATTLE 339.10 ▼ 3.16% LITHIUM 75.20 ▲ 1.47% PETR4 41.64 ▼ 0.05% VALE3 72.97 ▲ 0.83% ITUB4 38.60 ▼ 1.03% BBDC4 16.85 ▲ 0.36% ABEV3 14.89 ▼ 0.80% BBAS3 19.37 ▲ 0.47% B3SA3 14.26 ▼ 0.21% WEGE3 47.59 ▲ 0.49% PRIO3 59.14 ▼ 0.19% SUZB3 41.33 ▲ 2.35% RENT3 34.68 ▼ 0.09% AZZA3 15.89 ▼ 2.63% CSAN3 3.22 ▼ 1.83% RAIZ4 0.25 — 0.00% PCAR3 2.75 ▼ 0.36% GMAT3 3.65 ▼ 1.08% PSSA3 48.13 ▼ 0.54% CVCB3 1.33 ▼ 2.92% POSI3 3.36 ▲ 2.44% SLCE3 13.34 ▲ 0.30% NATU3 8.14 ▼ 0.73%
since 2009
Friday, September 18, 2026

Business - Brazil Market Reports

Banco do Brasil Reports R$ 9.5 Billion Profit in Q2 2024, an Increase of 8.2%

By · August 8, 2024 · 2 min read

The LatAm Brief

One email, every weekday morning. What moved in Latin American markets, politics and expat life.

Yesterday’s subject line: “Brazil raised welfare 15% — seventeen days before the vote”

Free. We send a confirmation link first — nothing arrives until you click it. Unsubscribe with one click in any edition. If you stop opening us for 30 days we stop sending by ourselves, as we assume the interest is no longer there. See our privacy policy. We never share your email.

Banco do Brasil (BBAS3) reported an adjusted net profit of R$ 9.502 billion ($1.70 billion) for Q2 2024.

This marked an 8.2% increase compared to the same period in 2023. On a quarterly basis, the profit rose by 2.2%. Analysts had expected a profit of R$ 9.43 billion ($1.68 billion).

Financial Performance and Key Metrics

Return on Equity (ROE)

The bank’s return on equity (ROE) reached 21.6%. This showed an increase of 0.3 percentage points (p.p.) year-over-year.

However, the ROE of the bank saw a slight decline of 0.1 p.p. compared to the previous quarter.
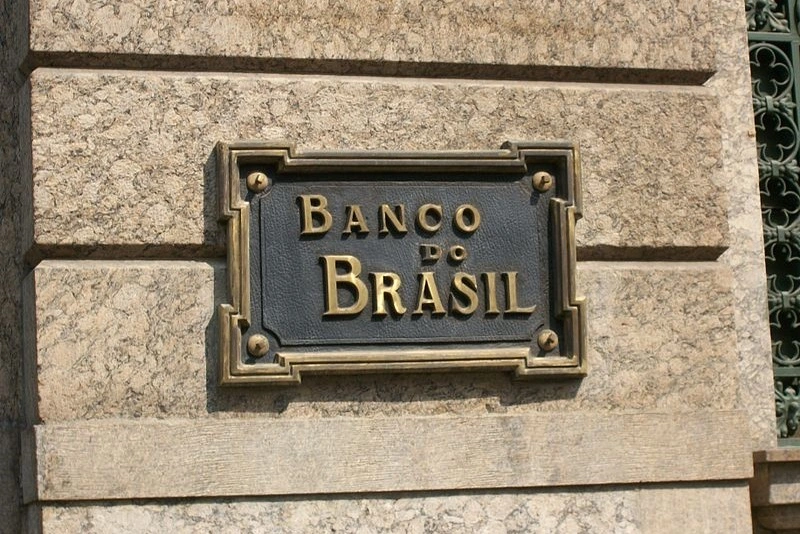
Banco do Brasil Reports R$ 9.5 Billion Profit in Q2 2024, an Increase of 8.2%.
RT
Ask Rio Times
Latin American markets, currencies and companies.
Open the full Ask Rio Times →

Financial Margin

The financial margin totaled R$ 25.54 billion ($4.56 billion). This represented an 11.6% increase over 12 months.

However, it marked a 0.7% decrease compared to the previous quarter. The margin with clients was R$ 19.85 billion ($3.54 billion).

This was down 1.5% year-over-year and 2.1% quarterly. Meanwhile, the market margin reached R$ 5.697 billion ($1.02 billion).

This showed a significant 100% increase over 12 months and a 4.4% rise from the previous quarter.

Credit Portfolio and Delinquency

Expanded Credit Portfolio

The expanded credit portfolio amounted to R$ 1.183 trillion ($211.25 billion). This grew by 13.21% over the past 12 months.

The agribusiness sector, which constitutes one-third of Banco do Brasil’s portfolio, stood out. Operations in this segment increased by 16.6% year-over-year.

Delinquency Rates

The long-term delinquency rate for loans overdue by more than 90 days stood at 3.0%. This was up by 0.27 p.p. year-over-year and 0.1 p.p. quarterly.

Comparative Performance

Banco do Brasil’s performance places it as the second most profitable bank in the market.

It trails only Itaú Unibanco, which reported a profit of R$ 10.072 billion ($1.80 billion) and a ROE of 22.4% for the same period.

Additional Financial Highlights

Service Revenues

Service revenues totaled R$ 8.8 billion ($1.57 billion). This marked a 6.7% increase, driven by higher income from fund management, credit operations, and current accounts.

Administrative Expenses

Administrative expenses reached R$ 9.2 billion ($1.64 billion). This was up from R$ 8.810 billion ($1.57 billion) a year earlier.

Provisions for Doubtful Debts (PDD)

Provisions for doubtful debts increased by 8.8% year-over-year to R$ 7.807 billion ($1.39 billion). However, they decreased by 8.6% compared to the first quarter of 2024.

Strategic Adjustments and Future Projections

Banco do Brasil has revised its projections for 2024. The bank now expects to provision between R$ 31 billion ($5.54 billion) and R$ 34 billion ($6.07 billion) for the entire year.

This is up from the initial estimate of R$ 27 billion ($4.82 billion) to R$ 30 billion ($5.36 billion).

The gross financial margin growth projection has also been revised upwards to a range of 10% to 13%. This compares to the previous forecast of 7% to 11%.

Conclusion

Banco do Brasil’s robust financial performance in Q2 2024 underscores its strategic focus on client proximity, innovation, and sustainable credit offerings.

Despite challenges such as rising delinquency rates and increased provisions for doubtful debts, the bank has demonstrated resilience and adaptability.

This positions it strongly in the competitive banking sector.

Banco do Brasil Reports R$ 9.5 Billion Profit in Q2 2024, an Increase of 8.2%

Live Company IntelligenceBanco do Brasil S.A. — the full investor dossierInside: live share price, market cap, three-year financials, valuation, ESG and peer benchmarks — plus the latest Rio Times coverage.
B
◆ Live Company Intelligence
Banco do Brasil
SA: BBAS3BBAS3Financial ServicesBanks – Regional84,619 employees
R$130.05B
Market cap

Valuation & profitability

Market capR$130.05B
Revenue (TTM)R$75.03B
P / E ratio10.6
Profit margin21.8%
Return on equity10.6%

Price & risk

52-wk low
$17.67
52-wk high
$27.36
Beta (volatility)0.23
200-day average$22.07

Revenue trend · 6y

20202025
Latest R$365.57B

Ownership

Institutions17.4%
Shares outstanding5.71B

Dividend

Yield2.8%
Payout ratio19.0%
Fwd. annual$0.14
What Banco do Brasil does. Banco do Brasil S.A., together with its subsidiaries, provides banking products and services for individuals, companies, and public sectors in Brazil and internationally. The company operates through Banking, Investments, Fund Management, Insurance (including insurance, private pension funds and capitalization) and Electronic Payments segments. Its Banking segment offers various products and services, including…
Data: RT fundamentals (BBAS3.SA) · figures in BRL · as of 18 Sep 2026More company intelligence →

This article was produced by The Rio Times’ automated newsroom system. How we use AI · Report an error

LatAm Markets: Live Signals → — real-time movers, turnover leaders and FX across Latin America.

Read More from The Rio Times

The Rio Times · Power Map
See who really holds power in Latin America
Click to open the Power Map

Rotate for Best Experience

This report is optimized for landscape viewing. Rotate your phone for the full experience.