Argentina and Brazil: a comparative analysis of the trajectory of health systems, 2001-2016
By Marcelo Rasga Moreira, Jose Mendes Ribeiro and Mariano Fontela
RIO DE JANEIRO, BRAZIL – This article aims to analyze the trajectories of the health systems of Argentina and Brazil from the period 2001-2016. It is the product of the research National Health Systems in Comparative Perspective: studies on local, regional and participatory management and the second of a series of three prepared for the journal Movimiento.
For the analysis, a model was developed composed of variables that, in the health sector, express political, economic, and overcoming inequalities aspects, articulating them in classic performance indicators of health systems.
The results indicate that, in the investigated period, there was an effective strengthening of the health systems in both countries and a reduction of inequalities. This, however, was not enough to prevent the existing social protection gap from widening between these two South American countries, on the one hand, and the European countries studied and the OECD average, on the other.
ANALYSIS OF THE TRAJECTORIES OF HEALTH SYSTEMS
The analysis begins with the relationship between the results of 2016 and those verified in 2001: ‘better’, ‘same’, or ‘worse’. It is not enough, however, to analyze and compare the performance of each system relative to its past, especially since the systems with the worst results in 2001 were expected to have improved in 2016.
The results of the systems are then compared with each other and with a point of reference: the OECD. This choice is because their countries’ results – expressed on a World Bank basis as the ‘OECD average’ – were very good in 2001 and improved in 2016.
Graph 1 and Table 1 summarize the main results obtained by applying the analytical model. As a form of contextualization, data from the countries surveyed are presented, but the analyzes focus on Argentina and Brazil.
Graph 1 shows that Argentina and Brazil are in Quadrant 3 (Q3), which corresponds to a ‘strengthening’ trajectory.
Throughout the 16 years studied and based on the indicators used in the model, both countries’ political-economic environment was favorable to improving health systems, which showed an equitable porosity and implemented –or improved– policies to overcome inequalities, expanding social protection.

In Table 1, it can be seen that, along this “strengthening” trajectory, Argentina and Brazil had a reduction in IMR and MMR and an increase in LEN. They differ only in the GB, where Argentina has a small increase, while Brazil promotes a reduction. Such scenarios indicate expansion of social protection and reduction of inequalities.
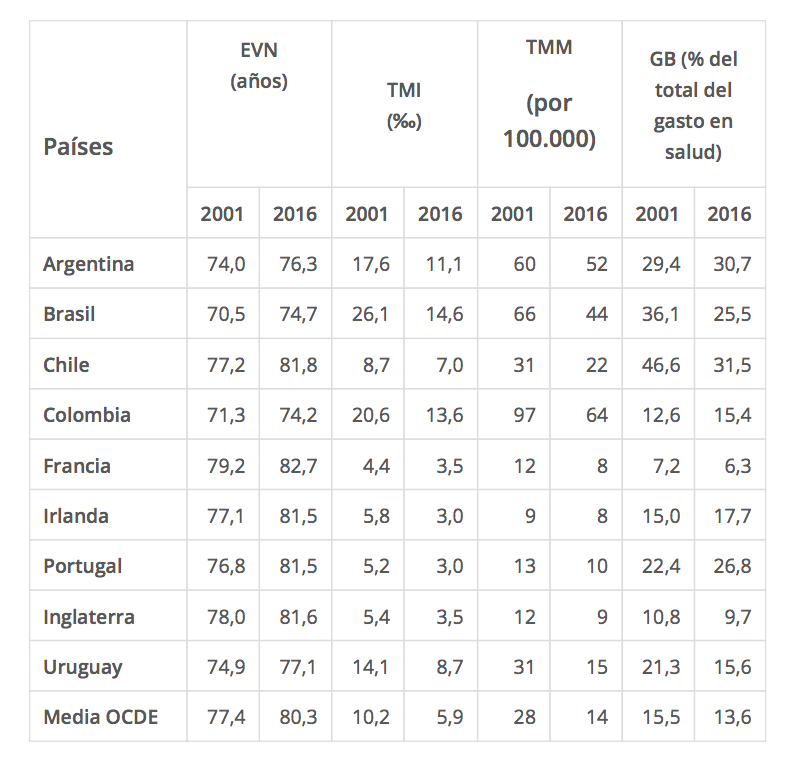
On the other hand, it can be seen, through Table 1, that the IMR, the MMR and the EVN reached in 2016 by the two countries are lower than those that the European countries studied and the OECD average already had in 2001.
As such indicators in the European countries studied and the OECD average also improved between 2001 and 2016, there was a widening of the gap verified in 2001.
If the countries that performed poorly in 2001 were not expected to improve to the point of exceeding to the others in 2016, it was also expected that there would be some narrowing of the gap between them, as those who were already doing very well in 2001 would have less ‘room’ to improve further.
But that is not what happened: the gaps, which were already large in 2001, increased in 2016.
The poor performance in 2001 of the indicators adopted by the research reflects the damage to social protection caused by the neoliberal policies of fiscal adjustment and reduction of the role of the State adopted in the 1990s in Argentina and Brazil.
Given this, at the beginning of the 21st century, policies to increase investment in public health systems were hegemonic –Peronist and PT governments– and proved to be powerful in improving the performance of health systems in their recent past, but they were not able to approximate them to the performance of the systems of the European countries and the OECD.
This indicates that the inequality caused by neoliberal policies is so harmful to a society that it can determine that living conditions are continually inferior to those of societies that develop social protection and welfare policies with greater consistency.
Between 2015 and 2016, Argentina and Brazil experienced changes in the hegemony of their political systems.
Its new leaders –elected in Argentina; due to an institutional coup in Brazil– they restricted the resources of the health systems, discontinued health programs and policies –in Argentina, they even lowered the rank of the Ministry of Health– and unfavorable policies’, which reveals that the system has resources, but that they are still subject to dispute.
[1] Research developed by a team from the Department of Social Sciences of the National School of Public Health, Oswaldo Cruz Foundation (DCS/ENSP/FIOCRUZ), Brazil, in ten countries. The Isalud University was in charge of applying the research in Argentina. From this alliance emerged the PIAPS (Health Policy Research Program), coordinated by the authors of the article
With information from
More: Argentina news in English, every day from The Rio Times.
Read More from The Rio Times