Venezuela and Nicaragua, the countries with the lowest “economic complexity” in LatAm
By Sebastián Osorio Idárraga
Economic growth is undoubtedly one of the main goals of every country and a constant concern for international organizations, especially in recent months when inflation has advanced by leaps and bounds.
One of the ways to evaluate this growth, beyond measuring the monetary value of the final goods and services produced in a country in a given time (Gross Domestic Product), is how the growth and product development process takes place through the Economic Complexity Index (ECI).
This index measures the knowledge intensity of an economy, taking into account the knowledge intensity of the products it exports, according to the Massachusetts Institute of Technology (MIT).
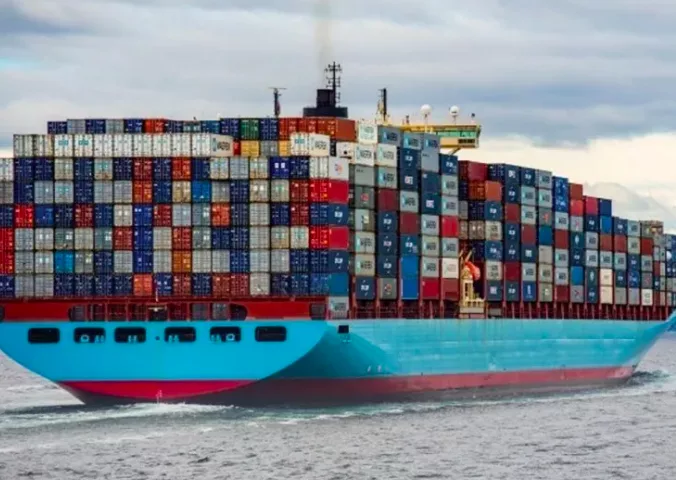
Thus, different organizations and experts define economic complexity as the type of productive structure of a country and the interrelation between its sectors.
The Observatory of Economic Complexity (OEC) points out that this powerful dimensionality reduction technique is used to predict and explain future economic growth and identify income inequality and greenhouse gas emissions.
HOW IS ECONOMIC COMPLEXITY IN LATIN AMERICA?
One of the ways to interpret this index is to identify that a country is more economically complex the more products it exports and fewer countries export these products, that is, the possibility of having a greater concentration or participation in the international market with these products.
Thus, Mexico has the highest economic complexity and leads the ranking in Latin America with a score of 1.09.
However, it is located in the 23rd position globally and is almost one point behind Japan, which leads this list with a score of 2.06.

Brazil (0.33), Panama (0.31), and Costa Rica (0.24) also stand out in the region.
“Economic complexity generates wealth because competitive advantage increases exports of high-tech products (…) countries with a more exceptional capacity to produce sophisticated goods are more likely to earn higher incomes than less productive countries,” detailed the Economic Commission for Latin America and the Caribbean (ECLAC) in an article published in August 2022.
However, not all Latin American countries have a wide range of products to export, much less sophisticated goods or services, since most of the countries in the region export mainly raw materials.
Thus, 10 of the 18 countries measured in 2021 by the OEC have a negative economic complexity index.
World Bank data up to 2018 showed that 55.3% of the region’s total exports are commodities, and only 20.8% of the workforce is attached to the industrial sector.
For this reason, countries such as Chile, Peru, and Ecuador have a negative score.
In addition, Venezuela and Nicaragua are the worst performers in this measurement, with scores of -1.08 and -1.03, respectively.
These are the global and regional positions of Latin American countries in the Economic Complexity Index, with figures up to 2021 from the Economic Complexity Observatory:
Top Top
Global Regional Country Score
23 1 Mexico 1.09
49 2 Brazil 0.33
51 3 Panama 0.31
52 4 Costa Rica 0.24
56 5 Colombia 0.14
57 6 Uruguay 0.10
60 7 Argentina 0.07
63 8 Dominican Republic 0.00
66 9 El Salvador -0.04
74 10 Chile -0.22
76 11 Guatemala -0.24
80 12 Paraguay -0.38
84 13 Honduras -0.50
91 14 Peru -0.63
104 15 Ecuador -0.89
106 16 Bolivia -0.97
108 17 Nicaragua -1.03
110 18 Venezuela -1.08
ARE THERE PROPOSALS TO IMPROVE SLUGGISH GROWTH?
Earlier this year, the Executive Secretary of the Economic Commission for Latin America and the Caribbean (ECLAC), José Manuel Salazar-Xirinachs, said that the cause of the low growth that has the region in a second lost decade is low productivity and lack of productive diversification.
“This is the real development crisis facing Latin America and the Caribbean.”
“The region has failed miserably to promote technological sophistication, economic complexity, and diversification of production and exports, which has caused all countries to fall into the middle-income trap,” he said in his participation in the World Economic Forum 2023.
For Salazar-Xirinachs, productivity has not grown “at all” in 30 years in Latin America and the Caribbean, the region with the worst productivity performance in the last 40 years.
“We know there are no easy recipes to achieve high, sustained, and sustainable growth.”
“There are no silver bullets.”
“A whole list of things must be right: investment climate, infrastructure, education, macroeconomic balances, good governance.”
“But one solution could be cluster initiative policies or cluster-based policies, which can be built from the bottom up, even if some of the factors on the competitiveness list are not 100% correct,” he explained.
Finally, he pointed out that clusters are specific forms of public-private partnerships where a governance space is created in which all relevant actors collaborate to promote competitiveness, job creation, innovation, skills, financing, and removing obstacles to the growth of the cluster, sector, or aggregation.
With information from Bloomberg
More: Latin America news in English, every day from The Rio Times.
In depth
Read More from The Rio Times