Rio Times Markets · Precious Metals
Key Facts
- Right now. At 10:50 a.m. ET on Friday, 30 October 2026, spot silver was US$49.00 an ounce, down 5.7% on the day, and spot gold US$3,890, down 3.3%. Both were at session lows.
- Since 19 October. From Monday’s open silver has lost 14.6% (US$8.38) and gold 7.0% (US$294) in nine sessions; from the highs since then silver is down 16.4% and gold 7.2%.
- Accelerating. Silver’s daily losses are growing: 1.0%, 3.7%, 5.7% on Wednesday, Thursday and Friday; gold lost 4.4% since Wednesday’s close, silver 9.1%.
- Five and seven days. Over five sessions silver is down 9.0% (US$4.87) and gold 2.6%; over seven sessions silver is down 14.7% (US$8.48) and gold 5.7% (about US$236).
- Steepening. In the last six hours silver lost 3.8% and gold 2.7%, against 0.9% and 0.0% in the six hours before.
- From the records. Gold is about 30% and silver almost 60% below their late-January 2026 peaks.
- Why. Futures markets price roughly an 85% chance of a Federal Reserve rate hike in December, and the 10-year Treasury yield is near 5%.
- What ends it. A recovery above the 4-hour average, about US$4,005 for gold and US$52.3 for silver, or a Fed signal of a pause.
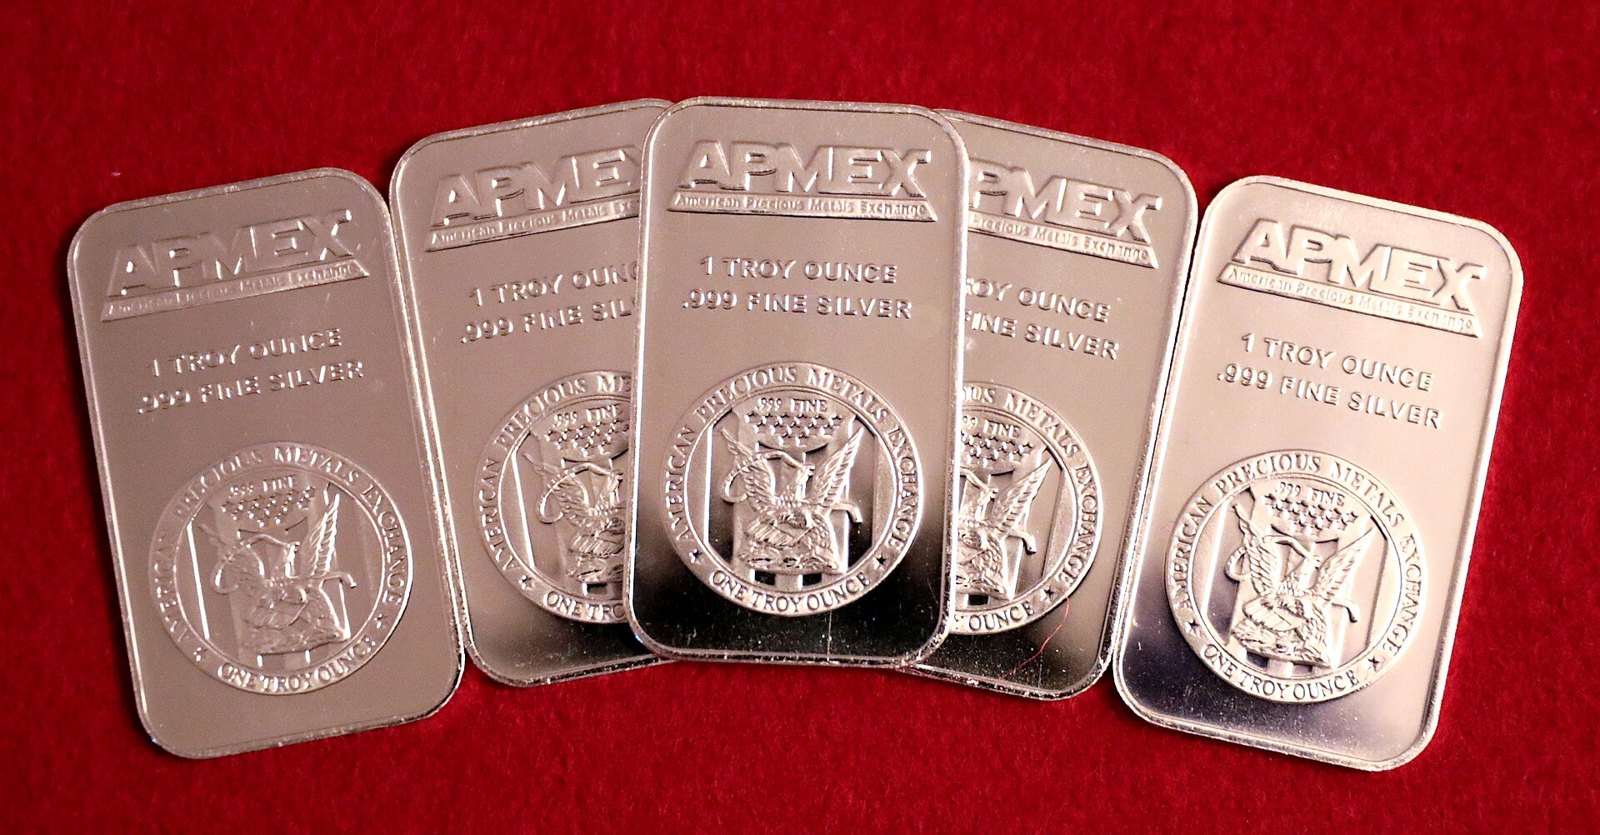
Silver fell 5.7% to US$49.00 an ounce and gold 3.3% to US$3,890 by 10:50 a.m. ET on Friday, 30 October, a second straight day of bigger losses. Silver has now lost 14.6% since 19 October and gold 7.0%, and the fall is steepening by the hour.
The Fall Is Speeding Up
Spot gold traded at US$3,890 an ounce at 10:50 a.m. ET on Friday, 30 October 2026, down 3.3% from Thursday’s close of US$4,022. Spot silver fell 5.7% to US$49.00, US$2.94 below its US$51.94 close.
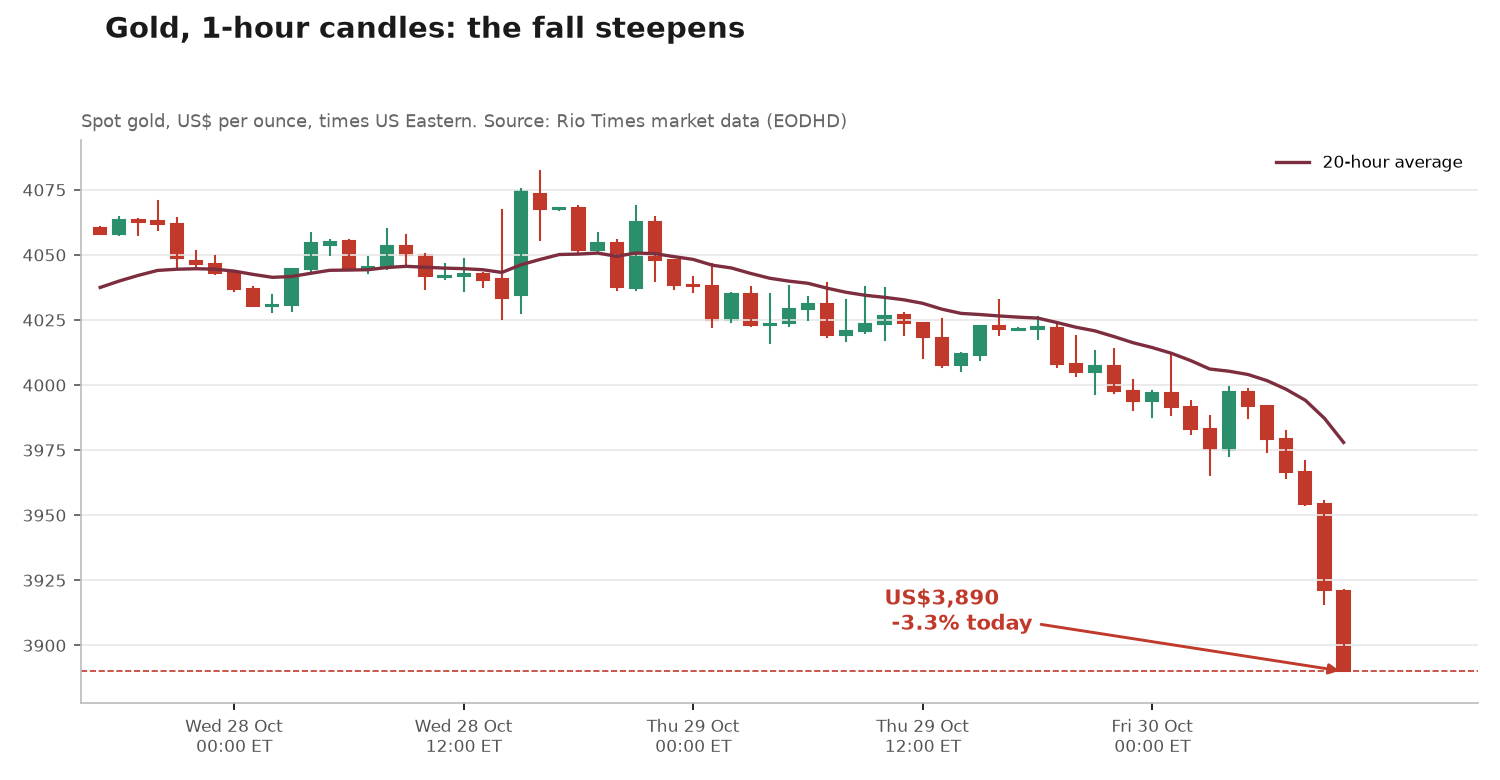
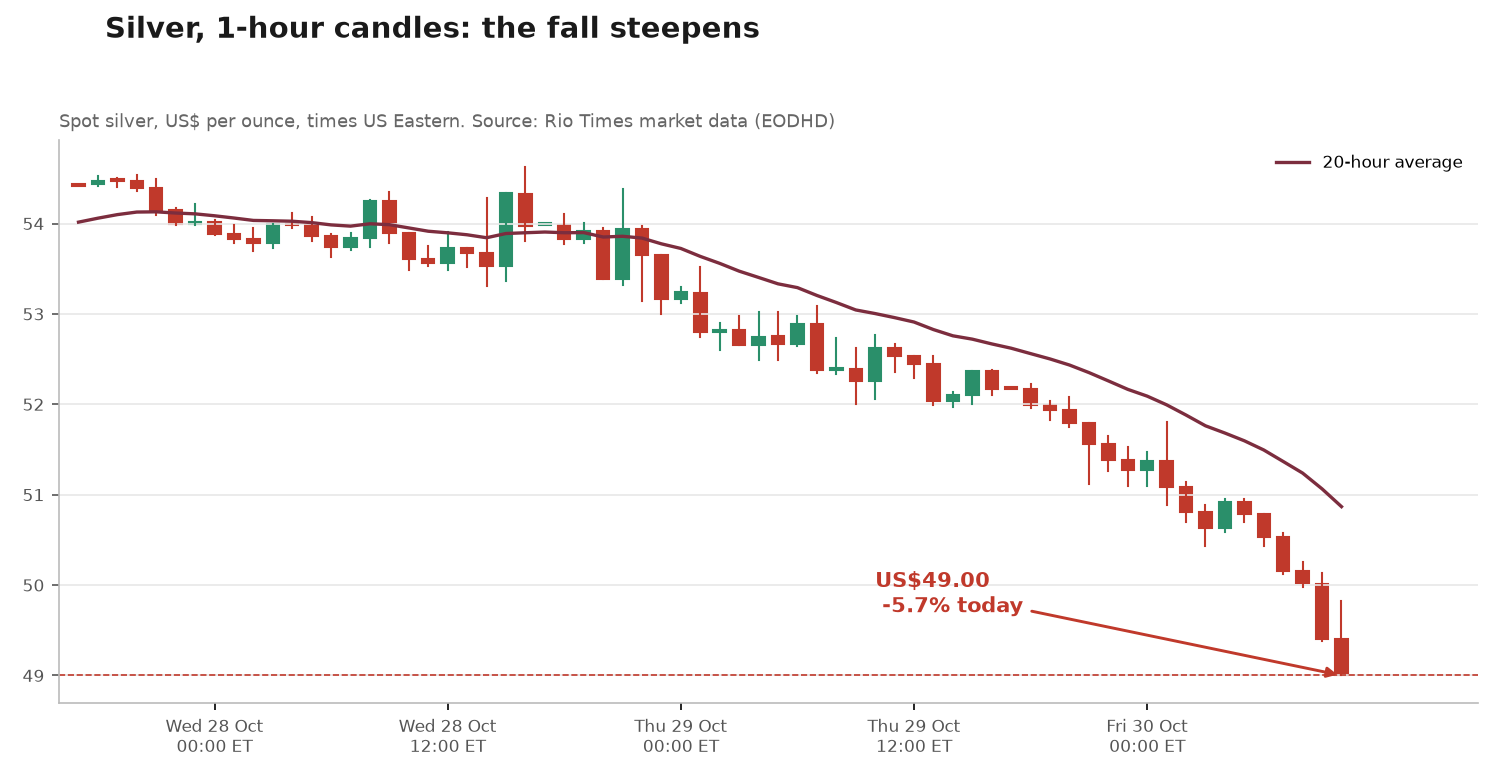
The fall is not steady but curved: gold lost 2.7% in the last six hours against 0.0% in the six hours before, and silver lost 3.8% against 0.9%. The steepest hour was the one beginning at 9 a.m. ET, when gold fell 0.84% and silver 1.22%, and both metals have printed six red hourly candles in a row.
On the 4-hour chart the latest candle took 1.9% off gold and 2.3% off silver, and silver has lost 4.4% in three 4-hour candles. Hourly readings of the Relative Strength Index, a gauge of how stretched a move is, are 17 for gold and 15 for silver; anything below 30 counts as oversold.
Two, Five and Seven Days
| Period | Gold | Silver |
|---|---|---|
| Mon 26 Oct | +0.5% | -0.0% |
| Tue 27 Oct | +1.2% | +1.1% |
| Wed 28 Oct | +0.2% | -1.0% |
| Thu 29 Oct | -1.2% | -3.7% |
| Fri 30 Oct (10:50 a.m. ET) | -3.3% | -5.7% |
| Two days (since Wed close) | -4.4% | -9.1% |
| Five sessions | -2.6% | -9.0% |
| Seven sessions | -5.7% | -14.7% |
| Since 19 Oct open (9 sessions) | -7.0% | -14.6% |
Spot prices, weekday closes; Friday at 10:50 a.m. ET. Source: Rio Times market data (RT).
The losses grow with every session: silver fell 1.0% on Wednesday, 3.7% on Thursday and 5.7% on Friday, and gold has lost 4.4% in two days. Over five sessions silver is down 9.0% and gold 2.6%; over seven sessions silver has lost 14.7%, or US$8.48 an ounce, and gold 5.7%, about US$236.
Both trade below their 50-day and 200-day moving averages. On the daily chart the RSI is 30.0 for gold and 23.0 for silver, a deeply oversold reading for silver.
Since 19 October
Measured from Monday 19 October, when gold opened at US$4,184 and silver at US$57.38, silver has lost 14.6%, or US$8.38 an ounce, in nine sessions and gold 7.0%, or US$294. From the highest prices since then, gold at US$4,190 that Monday and silver at US$58.60 on 20 October, silver is down 16.4% and gold 7.2%.
Compared with the close of Friday 16 October the losses are 14.1% for silver (US$8.02) and 6.7% for gold (US$278). Most of it has come in the last six sessions: silver was still above US$57 on Wednesday 21 October.
Why It Is Happening
The main driver is the Federal Reserve. It held its rate at 3.75% to 4.00% this week, but two policymakers, Lisa Cook and Michelle Bowman, voted for an immediate increase, and futures markets now price roughly an 85% chance of a hike in December.
Higher expected rates make interest-bearing assets more attractive than metals that pay nothing, and the 10-year Treasury yield, near 5%, and a stronger dollar add to the pressure. Silver falls faster because more than half of its demand is industrial and its market is smaller, so leveraged traders move it harder.
Has This Happened Before?
Yes, and much worse: on 30 January 2026, days after the records, silver fell 24.2% in one session and gold 10.5%, and silver lost about 32% in the seven sessions to 6 February. A silver drop of today’s size has occurred about 20 times since 2022, most recently on 14 October (5.5%), 28 September (5.4%) and 10 September (5.6%).
Even since that January crash there have been deeper slides: in March 2026 silver lost 22% and gold 14.5% in nine sessions, and in June silver lost about 18% and gold 10%. The current slide, with silver down 14.6% and gold 7.0% in nine sessions, is a serious one but not the largest of the year.
What is different is the combination: losses that grow day after day, a steepening intraday curve, and daily oversold readings in both metals at once. Silver’s 14.7% loss in seven sessions is among its five worst such stretches in the data and was last exceeded on 25 June 2026 (17.6%); gold’s 5.7% was last exceeded on 2 September (6.3%).
What Would End It
Accelerating drops of this shape are typical of forced selling, such as stop-loss orders and margin calls, and they often end in a sharp rebound. Gold trades about 2.2% and silver 3.7% below their 20-period hourly averages, which is stretched enough for a bounce.
A bounce would not change the trend, though, until prices recover the 4-hour 20-period average, about US$4,005 for gold and US$52.3 for silver. The Fed’s December meeting is the decisive date: a hike would deepen the slide, while a signal of a pause could spark a strong rebound.
What It Means for US Readers
For investors in gold and silver funds, coins or bars, the losses since the January peaks are now about 30% in gold and almost 60% in silver. Falling prices can look like a bargain, but an oversold market can stay oversold, and nothing in the chart yet marks a bottom.
Miners and jewelry buyers feel the move too: miners’ margins shrink with the metal price, while buyers of jewelry and coins see lower prices. Anyone who holds metals as a hedge against inflation should note that the market is pricing tighter policy, which works against them.
What Is Not Known
The Friday closing prices are not yet set, because the figures here are a 10:50 a.m. ET snapshot and final settlements may differ. How much of the move comes from algorithmic selling, forced liquidation, margin calls, options or physical flows has not been established.
Sources: Rio Times market data (spot prices, daily archive since 2022); Federal Reserve decision and futures-market pricing as reported; Treasury yield data. This is news, not investment advice.
Frequently Asked Questions
Why is silver falling more than gold?
Silver is a smaller market and more than half of its demand is industrial, so it reacts more to rate expectations and to leveraged trading. That is why silver lost 5.7% on Friday against 3.3% for gold.
Is this the worst sell-off in precious metals?
No. On 30 January 2026 silver fell 24.2% and gold 10.5% in a single session. What stands out now is that the losses grow every day and both metals are oversold at once.
How far have gold and silver fallen from their records?
Gold is about 30% below its peak of about US$5,596 on 28 January 2026, and silver almost 60% below its peak of about US$121.6 on 29 January. Both are far below their 200-day averages.
What would signal the sell-off is ending?
A recovery above the 4-hour 20-period average, about US$4,005 for gold and US$52.3 for silver, would be an early sign. A signal from the Fed that it will pause would be the stronger one.
This article was produced by The Rio Times’ automated newsroom system. How we use AI · Report an error · Editorial responsibility: Matthias Camenzind, Editor-in-Chief