IBOV 171,336.99 ▼ 0.52% IPC MEX 71,905.78 ▲ 0.05% MERVAL 2,848,945 — — USD/BRL5.57▼ 0.21% USD/MXN18.64▲ 0.07% USD/CLP984.09▼ 0.01% USD/COP3,299▲ 0.75% USD/PEN3.43▲ 0.51% USD/ARS1,545▼ 0.03% USD/UYU40.43▲ 3.48% USD/PYG6,196▲ 1.99% USD/BOB11.68▲ 1.36% USD/DOP60.67▲ 0.45% USD/CRC445.62▲ 1.58% USD/GTQ7.64▲ 3.18% USD/HNL26.89▲ 0.13% USD/NIO36.62▲ 1.17% USD/VES899.36▼ 0.13% USD/PAB1.00— 0.00% USD/BZD2.00— 0.00% USD/JMD157.69▲ 2.46% USD/TTD6.72▲ 2.30% EUR/BRL6.20▲ 0.44% BRENT 92.74 ▲ 1.37% WTI 86.64 ▲ 0.70% IRON ORE 161.91 — — COPPER 6.29 ▲ 1.20% GOLD 4,056 ▲ 0.64% SILVER 52.86 ▲ 3.44% SOY 1,222 ▼ 0.24% CORN 445.75 ▼ 0.72% WHEAT 591.75 ▼ 0.17% COFFEE 263.30 ▼ 2.98% SUGAR 18.16 ▲ 0.39% ORANGE JUICE 146.15 ▲ 5.64% COTTON 82.59 ▲ 4.96% COCOA 4,890 ▲ 3.12% BEEF 219.15 ▲ 1.36% CATTLE 330.48 ▲ 0.65% LITHIUM 59.98 ▼ 2.23% PETR4 44.95 ▼ 0.53% VALE3 64.80 ▼ 1.98% ITUB4 41.20 ▼ 1.25% BBDC4 14.54 ▼ 0.95% ABEV3 15.79 ▲ 1.15% BBAS3 17.10 ▲ 0.47% B3SA3 14.48 ▼ 2.49% WEGE3 50.95 ▲ 0.41% PRIO3 60.02 ▲ 1.06% SUZB3 54.46 ▲ 0.48% RENT3 29.79 ▼ 3.37% AZZA3 14.73 ▼ 2.58% CSAN3 2.68 ▼ 3.25% RAIZ4 0.30 ▼ 98.77% PCAR3 2.56 ▲ 5.35% GMAT3 3.81 ▼ 0.52% PSSA3 46.67 ▲ 2.23% CVCB3 0.86 ▼ 1.15% POSI3 3.15 ▲ 3.96% SLCE3 17.09 ▼ 1.21% NATU3 5.55 ▼ 2.80% BRKM5 2.92 ▼ 3.31% RANI3 8.45 ▼ 3.54% CSNA3 4.38 ▼ 2.45% IBOV 171,336.99 ▼ 0.52% IPC MEX 71,905.78 ▲ 0.05% MERVAL 2,848,945 — — USD/BRL 5.57 ▼ 0.19% USD/MXN 18.60 ▼ 0.11% USD/CLP 983.39 ▼ 0.08% USD/COP 3,299 ▲ 0.75% USD/PEN 3.42 ▲ 0.26% USD/ARS 1,545 ▼ 0.03% USD/UYU 40.43 ▲ 3.48% USD/PYG 6,196 ▲ 2.20% USD/BOB 11.68 ▲ 1.36% USD/DOP 60.46 ▲ 2.41% USD/CRC 445.62 ▲ 1.58% USD/GTQ 7.64 ▲ 3.18% USD/HNL 26.89 ▲ 0.13% USD/NIO 36.62 ▲ 1.17% USD/VES 899.36 ▼ 0.13% USD/PAB 1.00 — 0.00% USD/BZD 2.00 — 0.00% USD/JMD 157.69 ▲ 2.46% USD/TTD 6.72 ▲ 2.30% EUR/BRL 6.20 ▲ 0.45% BRENT 92.74 ▲ 1.37% WTI 86.64 ▲ 0.70% IRON ORE 161.91 — — COPPER 6.29 ▲ 1.20% GOLD 4,056 ▲ 0.64% SILVER 52.86 ▲ 3.44% SOY 1,222 ▼ 0.24% CORN 445.75 ▼ 0.72% WHEAT 591.75 ▼ 0.17% COFFEE 263.30 ▼ 2.98% SUGAR 18.16 ▲ 0.39% ORANGE JUICE 146.15 ▲ 5.64% COTTON 82.59 ▲ 4.96% COCOA 4,890 ▲ 3.12% BEEF 219.15 ▲ 1.36% CATTLE 330.48 ▲ 0.65% LITHIUM 59.98 ▼ 2.23% PETR4 44.95 ▼ 0.53% VALE3 64.80 ▼ 1.98% ITUB4 41.20 ▼ 1.25% BBDC4 14.54 ▼ 0.95% ABEV3 15.79 ▲ 1.15% BBAS3 17.10 ▲ 0.47% B3SA3 14.48 ▼ 2.49% WEGE3 50.95 ▲ 0.41% PRIO3 60.02 ▲ 1.06% SUZB3 54.46 ▲ 0.48% RENT3 29.79 ▼ 3.37% AZZA3 14.73 ▼ 2.58% CSAN3 2.68 ▼ 3.25% RAIZ4 0.30 ▼ 98.77% PCAR3 2.56 ▲ 5.35% GMAT3 3.81 ▼ 0.52% PSSA3 46.67 ▲ 2.23% CVCB3 0.86 ▼ 1.15% POSI3 3.15 ▲ 3.96% SLCE3 17.09 ▼ 1.21% NATU3 5.55 ▼ 2.80% BRKM5 2.92 ▼ 3.31% RANI3 8.45 ▼ 3.54% CSNA3 4.38 ▼ 2.45%
since 2009
Wednesday, November 11, 2026

East Asia Central Asia

Samsung Tops Asia’s Brand Rankings in Groundbreaking Survey

By · · 2 min read

Samsung Electronics has claimed the top spot as Asia’s leading brand, according to the 2024 Global Brand Survey by Nikkei Research.

This inaugural survey by the Tokyo-based firm evaluated 200 international companies, focusing on brand awareness, endorsements, and overall value.

Nikkei Research surveyed over 70,000 people across 11 Asian markets, including China, Taiwan, Thailand, India, Vietnam, Indonesia, Malaysia, and the Philippines.

Free daily brief — no card needed
Get every Central Asia story in one morning email
We build you a personalized brief around the topics you follow — free for 7 days. Love it? Your first month after that is US$1.

The survey aimed to measure brand power and influence on consumer purchasing decisions. Samsung emerged as the most valuable brand in eight Asian markets, surpassing global giants like Apple and Sony.

It ranked highest in Vietnam and secured a top-three position in Thailand and India. The survey highlighted that five of the top ten brands were from the electronics and technology sector.
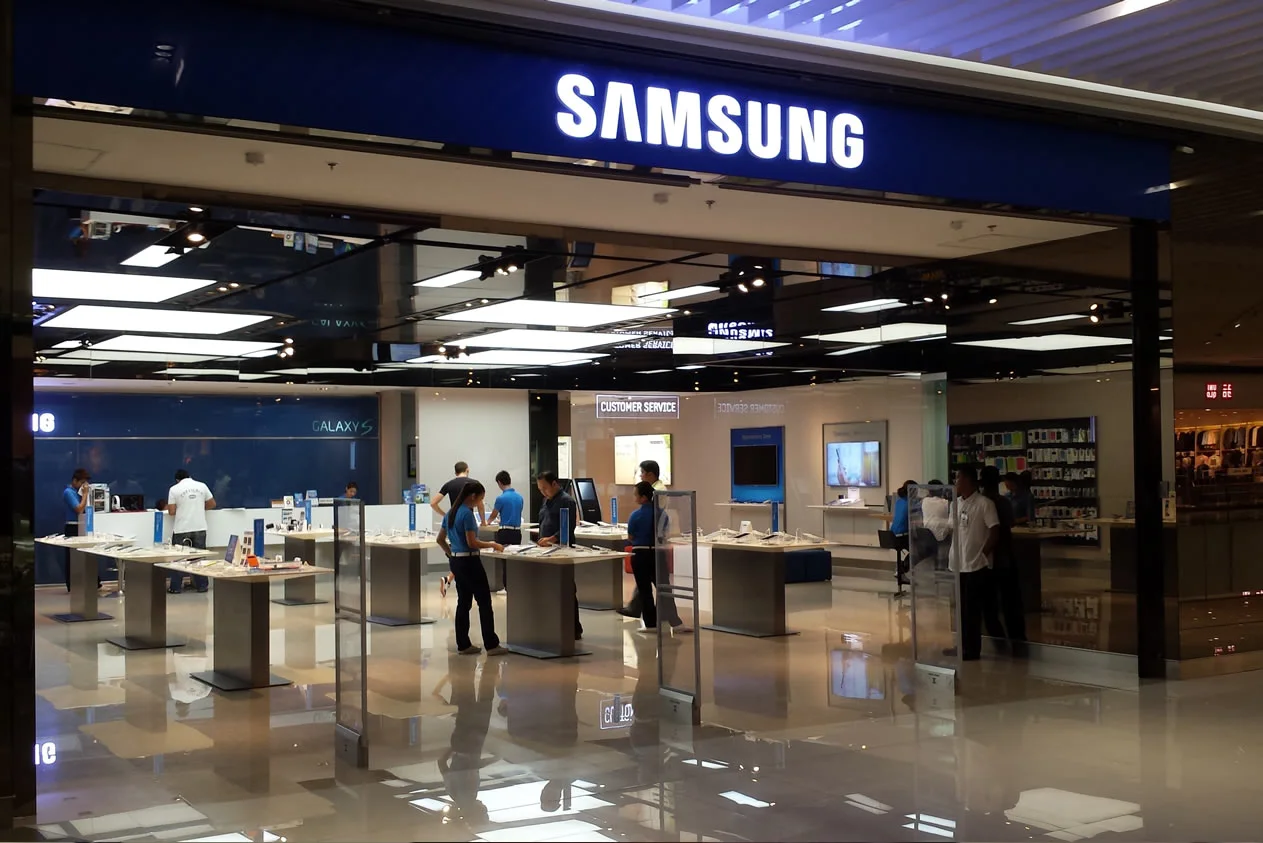
Samsung Tops Asia's Brand Rankings in Groundbreaking Survey
Samsung Tops Asia’s Brand Rankings in Groundbreaking Survey.
RT
Ask Rio Times
17 years of Latin America reporting, on demand.
Open the full Ask Rio Times →

Following Samsung were Adidas in second place, Apple in third, Sony in fourth, and Nike in fifth. The automotive industry also made a strong showing, with Honda in sixth place and Toyota in seventh.

The LatAm Brief

One email, every weekday morning. What moved in Latin American markets, politics and expat life.

Yesterday’s subject line: “Petrobras to pay shareholders US$2.7 billion”

Free. We send a confirmation link first — nothing arrives until you click it. Unsubscribe with one click in any edition. If you stop opening us for 30 days we stop sending by ourselves, as we assume the interest is no longer there. See our privacy policy. We never share your email.

Brand Performance in Asia

Japanese companies like Sony, Honda, Toyota, and Panasonic performed well due to their early expansion into Southeast Asia.

Meanwhile, four Korean companies featured prominently in the top 100 brands: Samsung Electronics, LG Electronics (16th), Hyundai Motor (26th), and Lotte (65th).

The survey revealed regional preferences for local brands. In India, Tata Motors ranked first, while in China, Haier and BYD secured top positions.

This indicates a strong preference for domestic brands in these countries. Kiyoshi Shitamori of Nikkei Research attributed Samsung‘s success to its high affinity score.

Samsung effectively integrates consumer insights from Asia into its product development. This makes its products integral to daily life for many consumers.

The company’s diverse offerings, including smartphones and home appliances, help maintain its strong market presence.

The survey excluded industries like hotels, luxury fashion, and information technology. This resulted in notable absences such as Amazon and Google.

Additionally, Southeast Asian companies were not part of this assessment. Samsung’s achievement underscores its strategic market positioning across diverse Asian markets.

This highlights the importance of understanding regional consumer behavior to build a strong brand presence. The survey reflects broader trends in consumer preferences across Asia, with technology and automotive brands dominating the landscape.

This article was produced by The Rio Times’ automated AI newsroom. Editorial responsibility: Matthias Camenzind, Publisher and Editor-in-Chief. The Rio Times also runs Ask Rio Times, which answers from 100,000+ of our own articles, the daily Latin America Power Map, and prediction-market odds on elections and markets.. How we use AI · Report an error

The Rio Times · Power Map
See who really holds power in Latin America
Click to open the Power Map →

Brazil runoff date: Sunday, October 25, poll closing times and when results start · Brazil runoff polls: Flávio 51%, Lula 49% · Kalshi and Polymarket odds

Rotate for Best Experience

This report is optimized for landscape viewing. Rotate your phone for the full experience.