IBOV 187,422.92 ▲ 0.44% IPSA 11,426.83 ▲ 0.61% IPC MEX 63,536.96 ▲ 0.25% MERVAL 2,997,659 ▼ 0.04% COLCAP 2,588.64 ▲ 0.90% BVL PERÚ 59,529.36 ▲ 1.84% USD/BRL5.10▼ 0.17% USD/MXN17.29▲ 0.38% USD/CLP943.65▼ 0.59% USD/COP3,197▲ 0.68% USD/PEN3.38▲ 0.04% USD/ARS1,514▼ 0.02% USD/UYU40.06▲ 2.88% USD/PYG5,918▲ 3.14% USD/BOB11.85▲ 25.24% USD/DOP59.17▲ 3.53% USD/CRC445.27▲ 2.84% USD/GTQ7.63▲ 3.24% USD/HNL26.86▲ 3.32% USD/NIO36.62▲ 2.80% USD/VES850.29▼ 0.13% USD/PAB1.00— 0.00% USD/BZD2.00— 0.00% USD/JMD 157.28 — 0.00% USD/TTD6.74▲ 2.48% EUR/BRL5.84▼ 0.97% BRENT 88.88 ▼ 0.03% WTI 83.11 ▼ 0.11% IRON ORE 161.91 — — COPPER 6.61 ▲ 0.03% GOLD 4,461 ▲ 1.78% SILVER 65.59 ▲ 1.26% SOY 1,184 ▲ 3.20% CORN 480.50 ▲ 10.02% WHEAT 655.00 ▲ 3.93% COFFEE 317.25 ▼ 5.51% SUGAR 16.43 ▼ 1.79% ORANGE JUICE 138.55 ▼ 0.47% COTTON 85.03 ▲ 2.33% COCOA 5,719 ▲ 3.18% BEEF 223.60 ▼ 3.93% CATTLE 339.10 ▼ 3.16% LITHIUM 75.20 ▲ 1.47% PETR4 41.64 ▼ 0.05% VALE3 72.97 ▲ 0.83% ITUB4 38.60 ▼ 1.03% BBDC4 16.85 ▲ 0.36% ABEV3 14.89 ▼ 0.80% BBAS3 19.37 ▲ 0.47% B3SA3 14.26 ▼ 0.21% WEGE3 47.59 ▲ 0.49% PRIO3 59.14 ▼ 0.19% SUZB3 41.33 ▲ 2.35% RENT3 34.68 ▼ 0.09% AZZA3 15.89 ▼ 2.63% CSAN3 3.22 ▼ 1.83% RAIZ4 0.25 — 0.00% PCAR3 2.75 ▼ 0.36% GMAT3 3.65 ▼ 1.08% PSSA3 48.13 ▼ 0.54% CVCB3 1.33 ▼ 2.92% POSI3 3.36 ▲ 2.44% SLCE3 13.34 ▲ 0.30% NATU3 8.14 ▼ 0.73% IBOV 187,422.92 ▲ 0.44% IPSA 11,426.83 ▲ 0.61% IPC MEX 63,536.96 ▲ 0.25% MERVAL 2,997,659 ▼ 0.04% COLCAP 2,588.64 ▲ 0.90% BVL PERÚ 59,529.36 ▲ 1.84% USD/BRL 5.16 ▲ 0.01% USD/MXN 17.06 ▼ 0.24% USD/CLP 913.98 ▲ 0.04% USD/COP 3,140 ▲ 0.03% USD/PEN 3.36 ▼ 0.66% USD/ARS 1,493 ▲ 0.10% USD/UYU 40.27 ▲ 1.24% USD/PYG 5,939 ▲ 1.68% USD/BOB 11.64 ▼ 0.76% USD/DOP 58.34 ▲ 1.25% USD/CRC 445.92 ▲ 0.89% USD/GTQ 7.62 ▲ 2.21% USD/HNL 26.79 ▲ 1.57% USD/NIO 36.62 ▲ 0.69% USD/VES 762.44 ▼ 0.13% USD/PAB 1.00 — 0.00% USD/BZD 2.00 — 0.00% USD/JMD 157.28 — 0.00% USD/TTD 6.70 ▲ 0.61% EUR/BRL 5.95 ▲ 1.01% BRENT 88.88 ▼ 0.03% WTI 83.11 ▼ 0.11% IRON ORE 161.91 — — COPPER 6.61 ▲ 0.03% GOLD 4,461 ▲ 1.78% SILVER 65.59 ▲ 1.26% SOY 1,184 ▲ 3.20% CORN 480.50 ▲ 10.02% WHEAT 655.00 ▲ 3.93% COFFEE 317.25 ▼ 5.51% SUGAR 16.43 ▼ 1.79% ORANGE JUICE 138.55 ▼ 0.47% COTTON 85.03 ▲ 2.33% COCOA 5,719 ▲ 3.18% BEEF 223.60 ▼ 3.93% CATTLE 339.10 ▼ 3.16% LITHIUM 75.20 ▲ 1.47% PETR4 41.64 ▼ 0.05% VALE3 72.97 ▲ 0.83% ITUB4 38.60 ▼ 1.03% BBDC4 16.85 ▲ 0.36% ABEV3 14.89 ▼ 0.80% BBAS3 19.37 ▲ 0.47% B3SA3 14.26 ▼ 0.21% WEGE3 47.59 ▲ 0.49% PRIO3 59.14 ▼ 0.19% SUZB3 41.33 ▲ 2.35% RENT3 34.68 ▼ 0.09% AZZA3 15.89 ▼ 2.63% CSAN3 3.22 ▼ 1.83% RAIZ4 0.25 — 0.00% PCAR3 2.75 ▼ 0.36% GMAT3 3.65 ▼ 1.08% PSSA3 48.13 ▼ 0.54% CVCB3 1.33 ▼ 2.92% POSI3 3.36 ▲ 2.44% SLCE3 13.34 ▲ 0.30% NATU3 8.14 ▼ 0.73%
since 2009
Tuesday, September 22, 2026

Northern Border Cities Lead Mexico’s Competitiveness Race

By · November 27, 2024 · 3 min read

The LatAm Brief

One email, every weekday morning. What moved in Latin American markets, politics and expat life.

Yesterday’s subject line: “68 strikes, 223 people. A UN expert says murder.”

Free. We send a confirmation link first — nothing arrives until you click it. Unsubscribe with one click in any edition. If you stop opening us for 30 days we stop sending by ourselves, as we assume the interest is no longer there. See our privacy policy. We never share your email.

Mexico’s northern border cities have emerged as the country’s most competitive urban centers. These cities demonstrate a superior ability to generate, attract, and retain talent and investment.

This trend highlights the economic divide between Mexico’s north and south, reflecting broader regional disparities. Saltillo, the capital of Coahuila, has claimed the top spot among cities with over one million inhabitants.

It outperformed major metropolitan areas like Mexico City, Monterrey, and Guadalajara. This achievement stems from Saltillo’s strong performance across various indicators measured by the Urban Competitiveness Index (ICU).

The ICU, developed by the Mexican Institute for Competitiveness (IMCO), evaluates cities based on 35 indicators. These are grouped into six sub-indices: Law, Society and Environment, Infrastructure, Labor Market, Political System and Government, and Innovation and Economy.

Cities are then ranked from very high to very low competitiveness. Saltillo’s success is particularly notable in the Law sub-index, where it ranked second in its category.
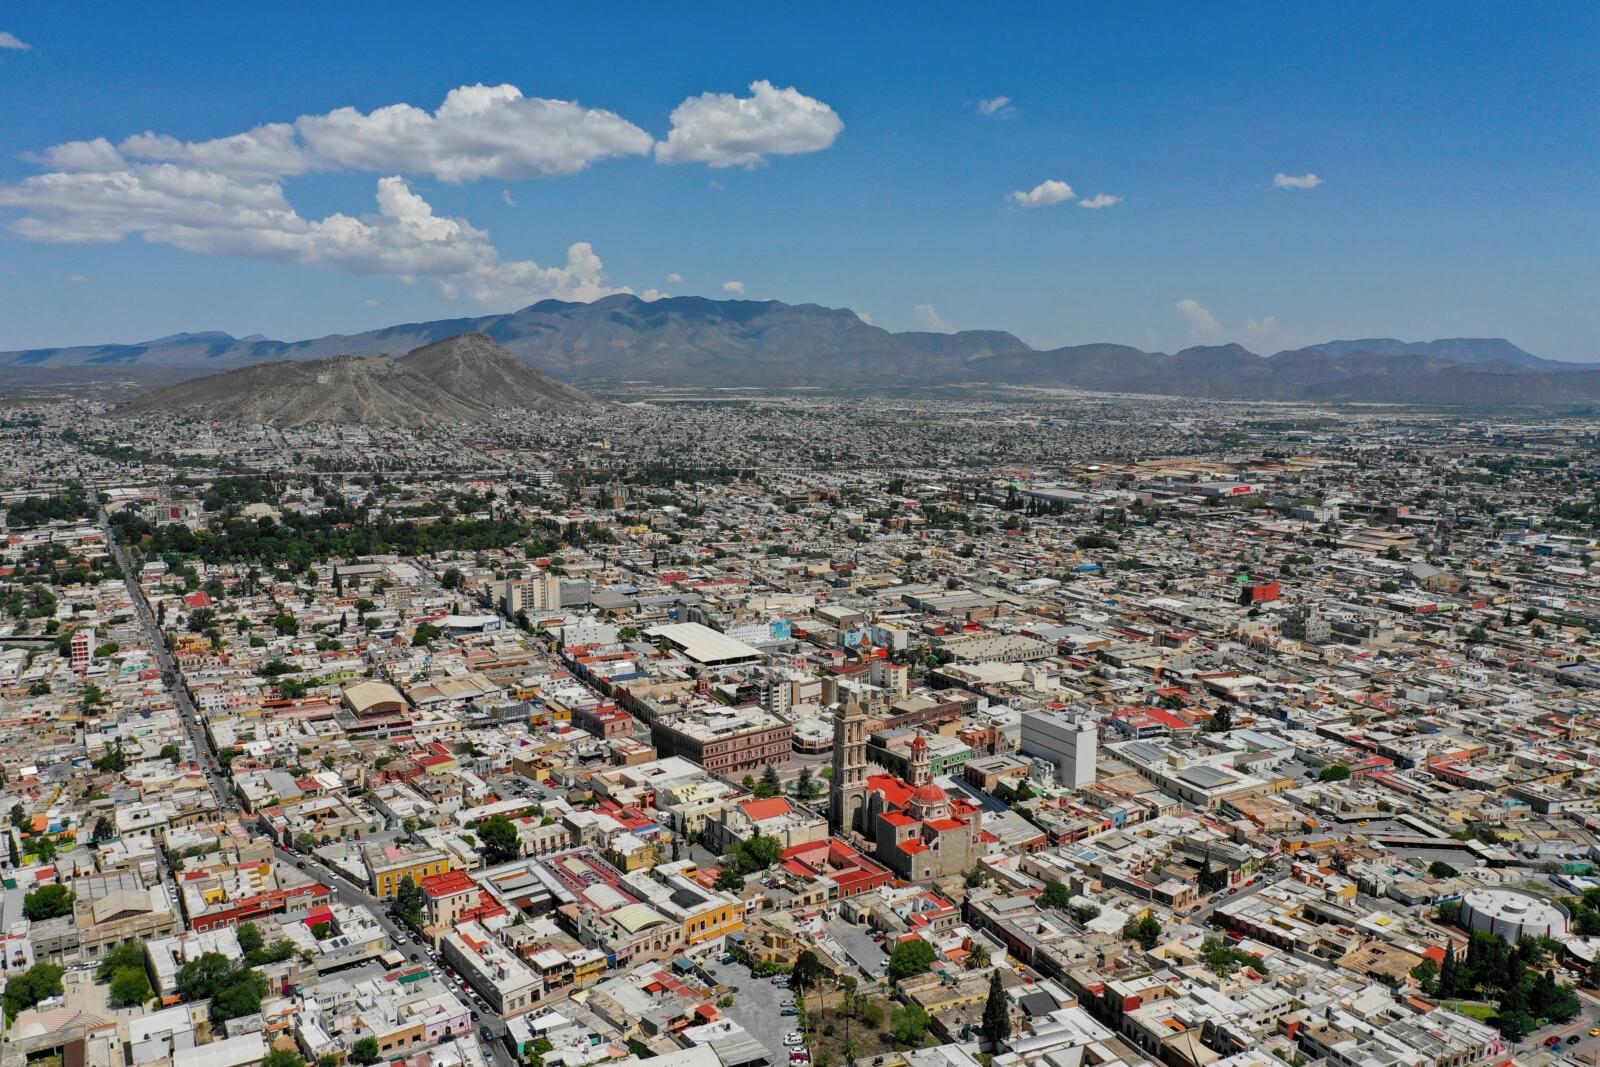
Northern Border Cities Lead Mexico's Competitiveness Race
Northern Border Cities Lead Mexico’s Competitiveness Race.
One-stop reference
Company Intelligence
Every listed company in Latin America — financials, ownership and structure for 1,450+ companies across 26 exchanges, in one place.
Browse the directory →
RT
Ask Rio Times
17 years of Latin America reporting, on demand.
Open the full Ask Rio Times →

This sub-index is closely tied to citizens’ quality of life and plays a crucial role in regional development. The city boasts low vehicle theft rates and homicide numbers, contributing to a high perception of safety among residents.

Mexico’s Urban Economic Landscape

In the Labor Market sub-index, Saltillo secured the third position. It offers the second-highest wages, with workers earning up to 468 pesos per hour.

The city also has a significant proportion of large businesses, with 2.6% of companies employing over 50 workers. Mexico City claimed the second spot overall, excelling in the Infrastructure sub-index.

The capital city leads in financial service usage, with 3.9 debit and credit cards per adult. It also boasts low transport-related accident rates and high internet access, with 41.4% of households connected.

Guadalajara, ranking fourth among large cities, stands out in Innovation and Economy. It has the second-highest number of patent registrations and efficiently uses energy for economic activities.

Monterrey secured the third position, showing strengths in both the Labor Market and Innovation and Economy sub-indices. The northern dominance extends to smaller urban centers as well.

Hermosillo leads cities with 500,000 to one million inhabitants, while La Paz tops the 250,000 to 500,000 population category. This pattern underscores the north’s economic advantages, likely due to proximity to the U.S. market and established industrial bases.

However, not all cities fared well in the rankings. Cancun, despite its tourism-driven economy, received low scores in Law, Infrastructure, and Society and Environment.

It struggles with waste management, healthcare staffing, and educational coverage. Other underperforming large cities include Tijuana, Cuernavaca, Toluca, Tlaxcala, and León.

Among mid-sized cities, Celaya, Matamoros, and Acapulco showed low competitiveness. Smaller cities like Colima, Zacatecas, Ciudad Victoria, Ciudad Obregón, and Chilpancingo also lagged behind their peers.

These results highlight the need for targeted development strategies in less competitive regions. This competitiveness landscape reveals Mexico’s complex economic geography.  Northern cities leverage their strategic locations and industrial bases.

In contrast, many central and southern urban areas face challenges in attracting investment and fostering innovation. Addressing these regional imbalances remains a key challenge for Mexico’s overall economic development.

This article was produced by The Rio Times’ automated newsroom system. How we use AI · Report an error

Read More from The Rio Times

The Rio Times · Power Map
See who really holds power in Latin America
Click to open the Power Map

Rotate for Best Experience

This report is optimized for landscape viewing. Rotate your phone for the full experience.