Kenya’s Pension Assets Hit a Record — but the State Leans Harder on Them
Kenya · Economy
Key Facts
—The total: Kenya’s pension assets reached about KSh2.81 trillion (about US$21.8 billion) at end-2025, up 24.57% year on year.
—State exposure: About 52.14% — roughly KSh1.47 trillion (about US$11.4 billion) — is invested in government securities.
—Record gains: Schemes posted KSh16.6 billion (about US$129 million) in capital gains in 2025.
—Returns: The average scheme returned about 24.8% in 2025.
—Fiscal squeeze: Debt service and pensions together took 51.8% of ordinary revenue in the year to June 2026.
—Pension bill: Public-pension payments alone were about KSh206.3 billion (about US$1.6 billion), or 9.1% of ordinary revenue.
Retirement savings are booming — but more than half of them are now propping up a government that keeps borrowing.
Kenya’s retirement savings just had a banner year. Industry assets climbed to about KSh2.81 trillion (about US$21.8 billion) by the end of 2025, up nearly a quarter on the year, according to the Retirement Benefits Authority. That is good news for anyone with a pension — and a reminder of an uncomfortable dependency, because a majority of that money is lent straight back to the state.
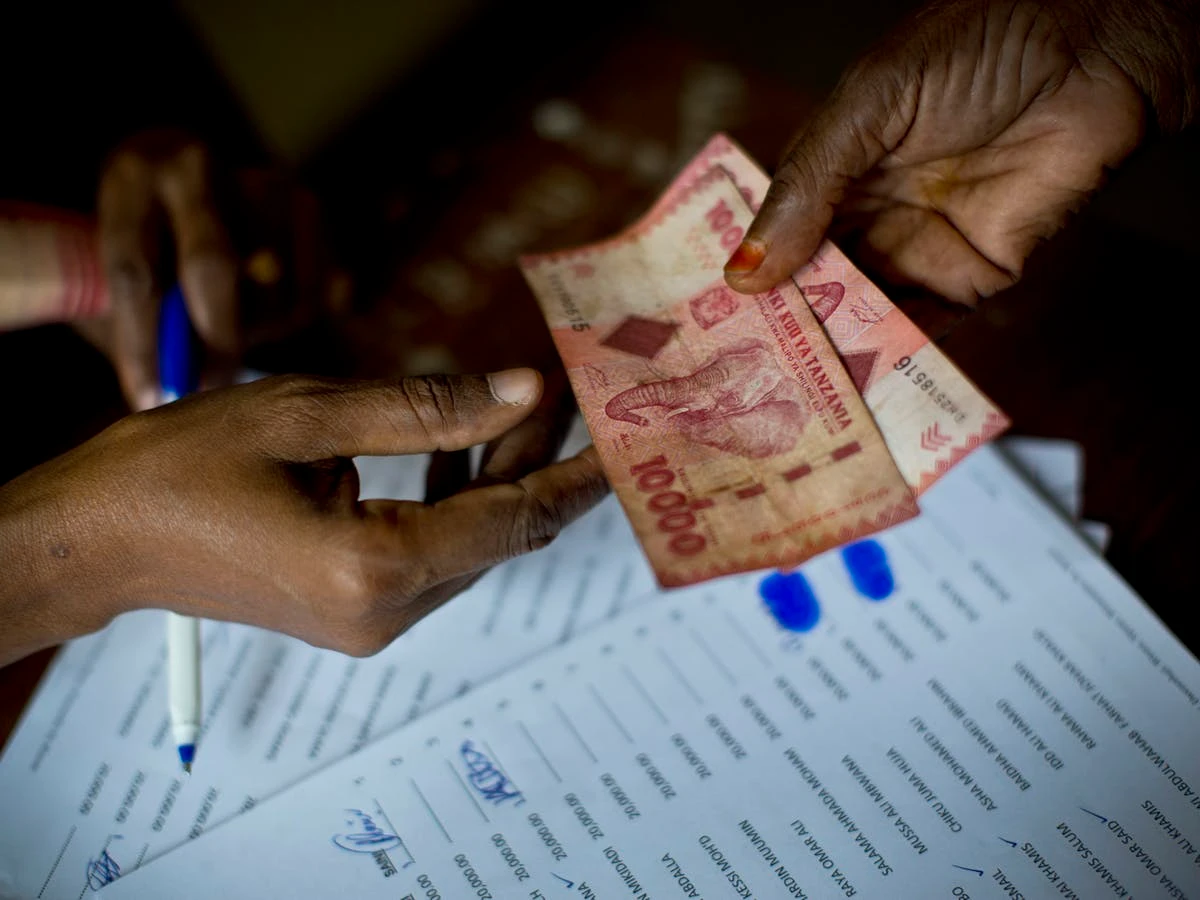
A record pension pot
The headline number is striking: assets under management rose 24.57% to about KSh2.81 trillion (about US$21.8 billion) in the year to December 2025. Schemes booked record capital gains of KSh16.6 billion (about US$129 million) — split between government securities and equities — and the average scheme returned about 24.8%, helped by falling interest rates that lifted bond prices.
Contributions are growing too. The National Social Security Fund (NSSF) saw contributions jump 35% to KSh83.97 billion (about US$651 million) in the year to June 2025, as higher statutory deduction rates took effect. More money is going in, and it is compounding faster.
The government’s growing appetite
Here is the catch. About 52.14% of pension assets — roughly KSh1.47 trillion (about US$11.4 billion) — sits in government securities. That concentration has been good for returns while rates fell, but it ties the retirement system’s health to the state’s finances, and those are stretched.
In the year to June 2026, debt service and pensions together consumed 51.8% of Kenya’s ordinary revenue, up from 49.8% a year earlier. Public-pension payments alone reached about KSh206.3 billion (about US$1.6 billion), or 9.1% of ordinary revenue. When more than half of what the state collects goes to interest and pensions before a single new project is funded, the pressure to keep borrowing — often from the same pension funds — only builds.
More: Kenya news in English, every day from The Rio Times.
A continental idea, and why you should care
Kenya’s pot is part of a much larger African pool. Pension funds across the continent hold an estimated US$700 billion in assets, and an initiative floated at the All-Africa Pensions Summit proposes pooling a small share — as little as 1% to 2% — into a ‘Development Fund for Africa’ to finance infrastructure. It is early and unproven, but it captures the same tension Kenya faces: how to put long-term savings to work without simply funding deficits.
For savers and investors, the takeaway is practical. A pension system this exposed to government debt rises and falls with the sovereign. Strong 2025 returns are real, but so is the concentration risk — and it is worth knowing exactly where your retirement money is invested.
Frequently Asked Questions
How big are Kenya’s pension assets?
They reached about KSh2.81 trillion (about US$21.8 billion) at the end of 2025, up 24.57% year on year, according to the Retirement Benefits Authority.
How much is invested in government debt?
About 52.14% — roughly KSh1.47 trillion (about US$11.4 billion) — is held in government securities, tying the system’s returns to the state’s finances.
What is the fiscal-pressure concern?
In the year to June 2026, debt service and pensions together took 51.8% of ordinary revenue, with public pensions alone at about KSh206.3 billion (about US$1.6 billion).
Sources
This article was produced by The Rio Times’ automated newsroom system. How we use AI · Report an error
LatAm Markets: Live Signals → — real-time movers, turnover leaders and FX across Latin America.
Read More from The Rio Times