IBOV 186,118.29 ▲ 0.48% IPSA 11,310.05 ▼ 0.62% IPC MEX 63,375.93 ▼ 0.78% MERVAL 3,004,554 ▼ 0.58% COLCAP 2,547.60 ▼ 0.02% BVL PERÚ 59,344.04 ▲ 0.07% USD/BRL5.11▼ 0.66% USD/MXN17.22▼ 0.07% USD/CLP946.90▼ 1.31% USD/COP3,198▲ 0.73% USD/PEN3.35▼ 0.69% USD/ARS1,514▼ 0.03% USD/UYU40.14▼ 0.05% USD/PYG5,926▲ 0.34% USD/BOB10.95▲ 10.05% USD/DOP58.80▲ 0.09% USD/CRC443.27▼ 0.27% USD/GTQ7.63▼ 0.05% USD/HNL26.86▲ 0.03% USD/NIO36.62— 0.00% USD/VES847.44▼ 0.13% USD/PAB1.00— 0.00% USD/BZD2.00— 0.00% USD/JMD 157.28 — 0.00% USD/TTD6.76▲ 0.17% EUR/BRL5.86▼ 0.91% BRENT 88.88 ▼ 0.03% WTI 83.11 ▼ 0.11% IRON ORE 161.91 — — COPPER 6.61 ▲ 0.03% GOLD 4,461 ▲ 1.78% SILVER 65.59 ▲ 1.26% SOY 1,184 ▲ 3.20% CORN 480.50 ▲ 10.02% WHEAT 655.00 ▲ 3.93% COFFEE 317.25 ▼ 5.51% SUGAR 16.43 ▼ 1.79% ORANGE JUICE 138.55 ▼ 0.47% COTTON 85.03 ▲ 2.33% COCOA 5,719 ▲ 3.18% BEEF 223.60 ▼ 3.93% CATTLE 339.10 ▼ 3.16% LITHIUM 75.20 ▲ 1.47% PETR4 41.64 ▼ 0.05% VALE3 72.97 ▲ 0.83% ITUB4 38.60 ▼ 1.03% BBDC4 16.85 ▲ 0.36% ABEV3 14.89 ▼ 0.80% BBAS3 19.37 ▲ 0.47% B3SA3 14.26 ▼ 0.21% WEGE3 47.59 ▲ 0.49% PRIO3 59.14 ▼ 0.19% SUZB3 41.33 ▲ 2.35% RENT3 34.68 ▼ 0.09% AZZA3 15.89 ▼ 2.63% CSAN3 3.22 ▼ 1.83% RAIZ4 0.25 — 0.00% PCAR3 2.75 ▼ 0.36% GMAT3 3.65 ▼ 1.08% PSSA3 48.13 ▼ 0.54% CVCB3 1.33 ▼ 2.92% POSI3 3.36 ▲ 2.44% SLCE3 13.34 ▲ 0.30% NATU3 8.14 ▼ 0.73% IBOV 186,118.29 ▲ 0.48% IPSA 11,310.05 ▼ 0.62% IPC MEX 63,375.93 ▼ 0.78% MERVAL 3,004,554 ▼ 0.58% COLCAP 2,547.60 ▼ 0.02% BVL PERÚ 59,344.04 ▲ 0.07% USD/BRL 5.16 ▲ 0.01% USD/MXN 17.06 ▼ 0.24% USD/CLP 913.98 ▲ 0.04% USD/COP 3,140 ▲ 0.03% USD/PEN 3.36 ▼ 0.66% USD/ARS 1,493 ▲ 0.10% USD/UYU 40.27 ▲ 1.24% USD/PYG 5,939 ▲ 1.68% USD/BOB 11.64 ▼ 0.76% USD/DOP 58.34 ▲ 1.25% USD/CRC 445.92 ▲ 0.89% USD/GTQ 7.62 ▲ 2.21% USD/HNL 26.79 ▲ 1.57% USD/NIO 36.62 ▲ 0.69% USD/VES 762.44 ▼ 0.13% USD/PAB 1.00 — 0.00% USD/BZD 2.00 — 0.00% USD/JMD 157.28 — 0.00% USD/TTD 6.70 ▲ 0.61% EUR/BRL 5.95 ▲ 1.01% BRENT 88.88 ▼ 0.03% WTI 83.11 ▼ 0.11% IRON ORE 161.91 — — COPPER 6.61 ▲ 0.03% GOLD 4,461 ▲ 1.78% SILVER 65.59 ▲ 1.26% SOY 1,184 ▲ 3.20% CORN 480.50 ▲ 10.02% WHEAT 655.00 ▲ 3.93% COFFEE 317.25 ▼ 5.51% SUGAR 16.43 ▼ 1.79% ORANGE JUICE 138.55 ▼ 0.47% COTTON 85.03 ▲ 2.33% COCOA 5,719 ▲ 3.18% BEEF 223.60 ▼ 3.93% CATTLE 339.10 ▼ 3.16% LITHIUM 75.20 ▲ 1.47% PETR4 41.64 ▼ 0.05% VALE3 72.97 ▲ 0.83% ITUB4 38.60 ▼ 1.03% BBDC4 16.85 ▲ 0.36% ABEV3 14.89 ▼ 0.80% BBAS3 19.37 ▲ 0.47% B3SA3 14.26 ▼ 0.21% WEGE3 47.59 ▲ 0.49% PRIO3 59.14 ▼ 0.19% SUZB3 41.33 ▲ 2.35% RENT3 34.68 ▼ 0.09% AZZA3 15.89 ▼ 2.63% CSAN3 3.22 ▼ 1.83% RAIZ4 0.25 — 0.00% PCAR3 2.75 ▼ 0.36% GMAT3 3.65 ▼ 1.08% PSSA3 48.13 ▼ 0.54% CVCB3 1.33 ▼ 2.92% POSI3 3.36 ▲ 2.44% SLCE3 13.34 ▲ 0.30% NATU3 8.14 ▼ 0.73%
since 2009
Monday, September 21, 2026

World-News North America

JD Vance in India: Navigating Tariffs, Trade, and Strategic Ties

By · April 21, 2025 · 2 min read

The LatAm Brief

One email, every weekday morning. What moved in Latin American markets, politics and expat life.

Yesterday’s subject line: “Venezuela's New York week: oil signed, the bounty stays”

Free. We send a confirmation link first — nothing arrives until you click it. Unsubscribe with one click in any edition. If you stop opening us for 30 days we stop sending by ourselves, as we assume the interest is no longer there. See our privacy policy. We never share your email.

US Vice President JD Vance landed in New Delhi on April 21, 2025, for a four-day visit that sits at the heart of a tense trade standoff between the US and India.

The visit comes as the Trump administration threatens to raise tariffs on Indian exports from 10% to 26% if no trade deal is reached by July. Vance’s trip includes meetings with Prime Minister Narendra Modi and cultural stops with his family.

It marks a critical moment for both nations’ economic futures. The US is India’s largest trading partner, with bilateral trade reaching $129 billion in 2024 and India running a $45.7 billion surplus.

Trump’s tariff policy, announced in early April, imposes a baseline 10% duty on Indian goods, with a threatened hike to 26%—a move that could shrink Indian exports to the US by 6.4%, or about $5.8 billion, this year alone.

Sectors facing the greatest risk include marine products, gems and jewelry, automobiles, electronics, and textiles. For example, U.S. tariffs on Indian auto parts and steel currently stand at 25%.
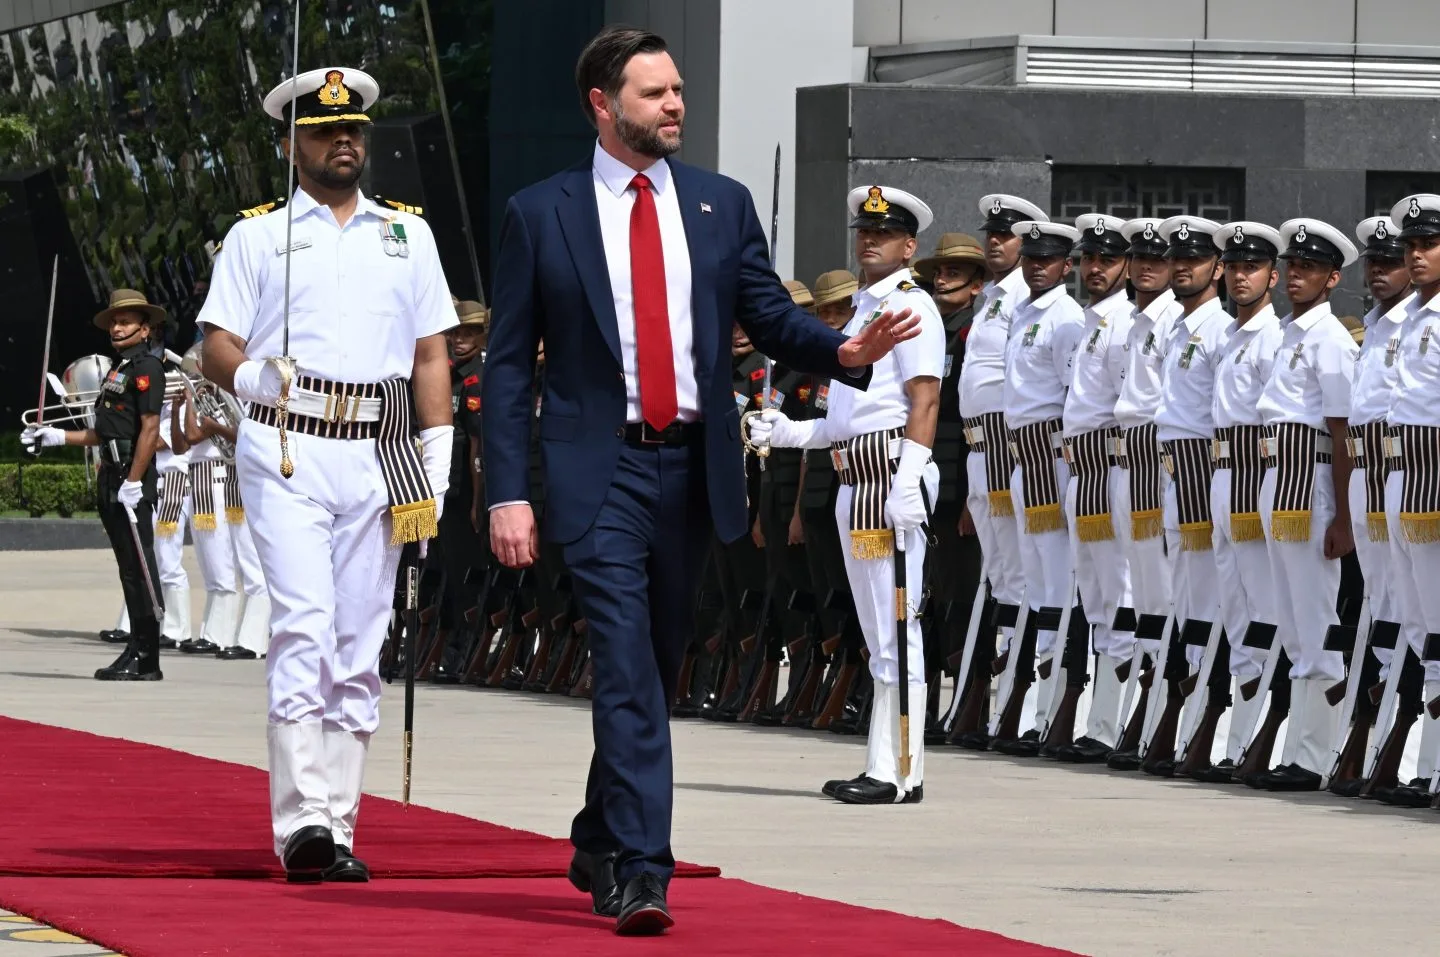
JD Vance in India: Navigating Tariffs, Trade, and Strategic Ties
JD Vance in India: Navigating Tariffs, Trade, and Strategic Ties.
One-stop reference
Company Intelligence
Every listed company in Latin America — financials, ownership and structure for 1,450+ companies across 26 exchanges, in one place.
Browse the directory →
RT
Ask Rio Times
17 years of Latin America reporting, on demand.
Open the full Ask Rio Times →

If the full 26% rate is implemented, Indian goods will become less competitive, forcing buyers to look elsewhere and putting pressure on Indian manufacturers and jobs. Despite the threat, India’s economy shows some resilience.

Only 18% of India’s total exports go to the US, and sectors like pharmaceuticals (10% of US-bound exports) remain exempt from the new tariffs. India’s domestic demand-driven economy, valued at $3.5 trillion, gives it more room to maneuver compared to export-heavy rivals like Vietnam.

India and US Discuss Trade Relations

However, a prolonged tariff hike could shave 0.5% off India’s GDP growth, according to market analysts, and trigger a shift in supply chains to other Asian countries. The talks between Vance and Modi focus on more than tariffs. Both sides want to double bilateral trade to $500 billion by 2030.

India seeks to protect its agriculture and dairy sectors, while the US pushes for greater market access and “fairness” in trade. Defense and technology also play a central role, with India planning to buy and co-produce US military equipment such as Javelin missiles and Stryker vehicles.

All figures and claims in this article are based on official trade data, government statements, and direct reporting from April 2025.

This article was produced by The Rio Times’ automated newsroom system. How we use AI · Report an error

Read More from The Rio Times

The Rio Times · Power Map
See who really holds power in Latin America
Click to open the Power Map

Rotate for Best Experience

This report is optimized for landscape viewing. Rotate your phone for the full experience.