Soybean Fund Rises 2.8% as US Cuts Corn Yield | Grains Wrap, Nov 10

Key Facts
- Soybeans led the rebound: the soybean-tracking fund SOYB closed at US$25.92, +2.78%, after the US government trimmed its estimate of American grain stocks.
- Corn followed on a smaller US crop: the corn-tracking fund CORN rose +1.11% to US$17.35 after Washington cut its yield forecast again.
- Wheat barely stirred: the wheat-tracking fund WEAT gained +0.46% to US$21.75, still 22.4% below its 28 August high.
- Brazil is planting a record: the state crop agency Conab estimated in October that Brazil will harvest 181.64 million tonnes of soybeans, the biggest harvest the country has grown.
- A bounce inside a downtrend: CORN is still 14.5% below its 1 September high, so one good day has not changed the direction.
Today’s Focus
Grain prices rose across the board on Tuesday, 10 November 2026. The trigger was the US Department of Agriculture’s monthly supply report, which cut the expected size of the American corn crop and lowered its estimate of grain left in storage.
Soybeans did best, with the SOYB fund up +2.78%. Corn rose +1.11% and wheat +0.46%.
The gains come after a bruising month. Over 20 sessions, SOYB is down 5.16% and CORN is down 6.11%, so this reads as a pause in a slide, not a turn.
What matters today. Smaller US supplies helped prices for a day, but Brazil’s record soybean crop is the larger force over the coming months.
01 The session in one read
Think of a grain market as a pantry: when the shelves look emptier than expected, prices rise. On Tuesday, 10 November 2026, Washington told traders its shelves were emptier.
The USDA lowered its corn yield estimate, meaning fewer bushels harvested from each acre, and trimmed expected US grain stocks. Soybeans, corn and wheat all rose, led by soybeans.
The US report gave grains a genuine reason to rise, since a smaller crop and thinner stocks mean less cushion if weather turns. Yet a record Brazilian harvest is being planted right now and will reach ports from early next year, and that supply is still the heavier weight on prices. The variable to watch is whether soybeans can hold above their recent range once Brazilian planting and weather reports start to dominate the news.
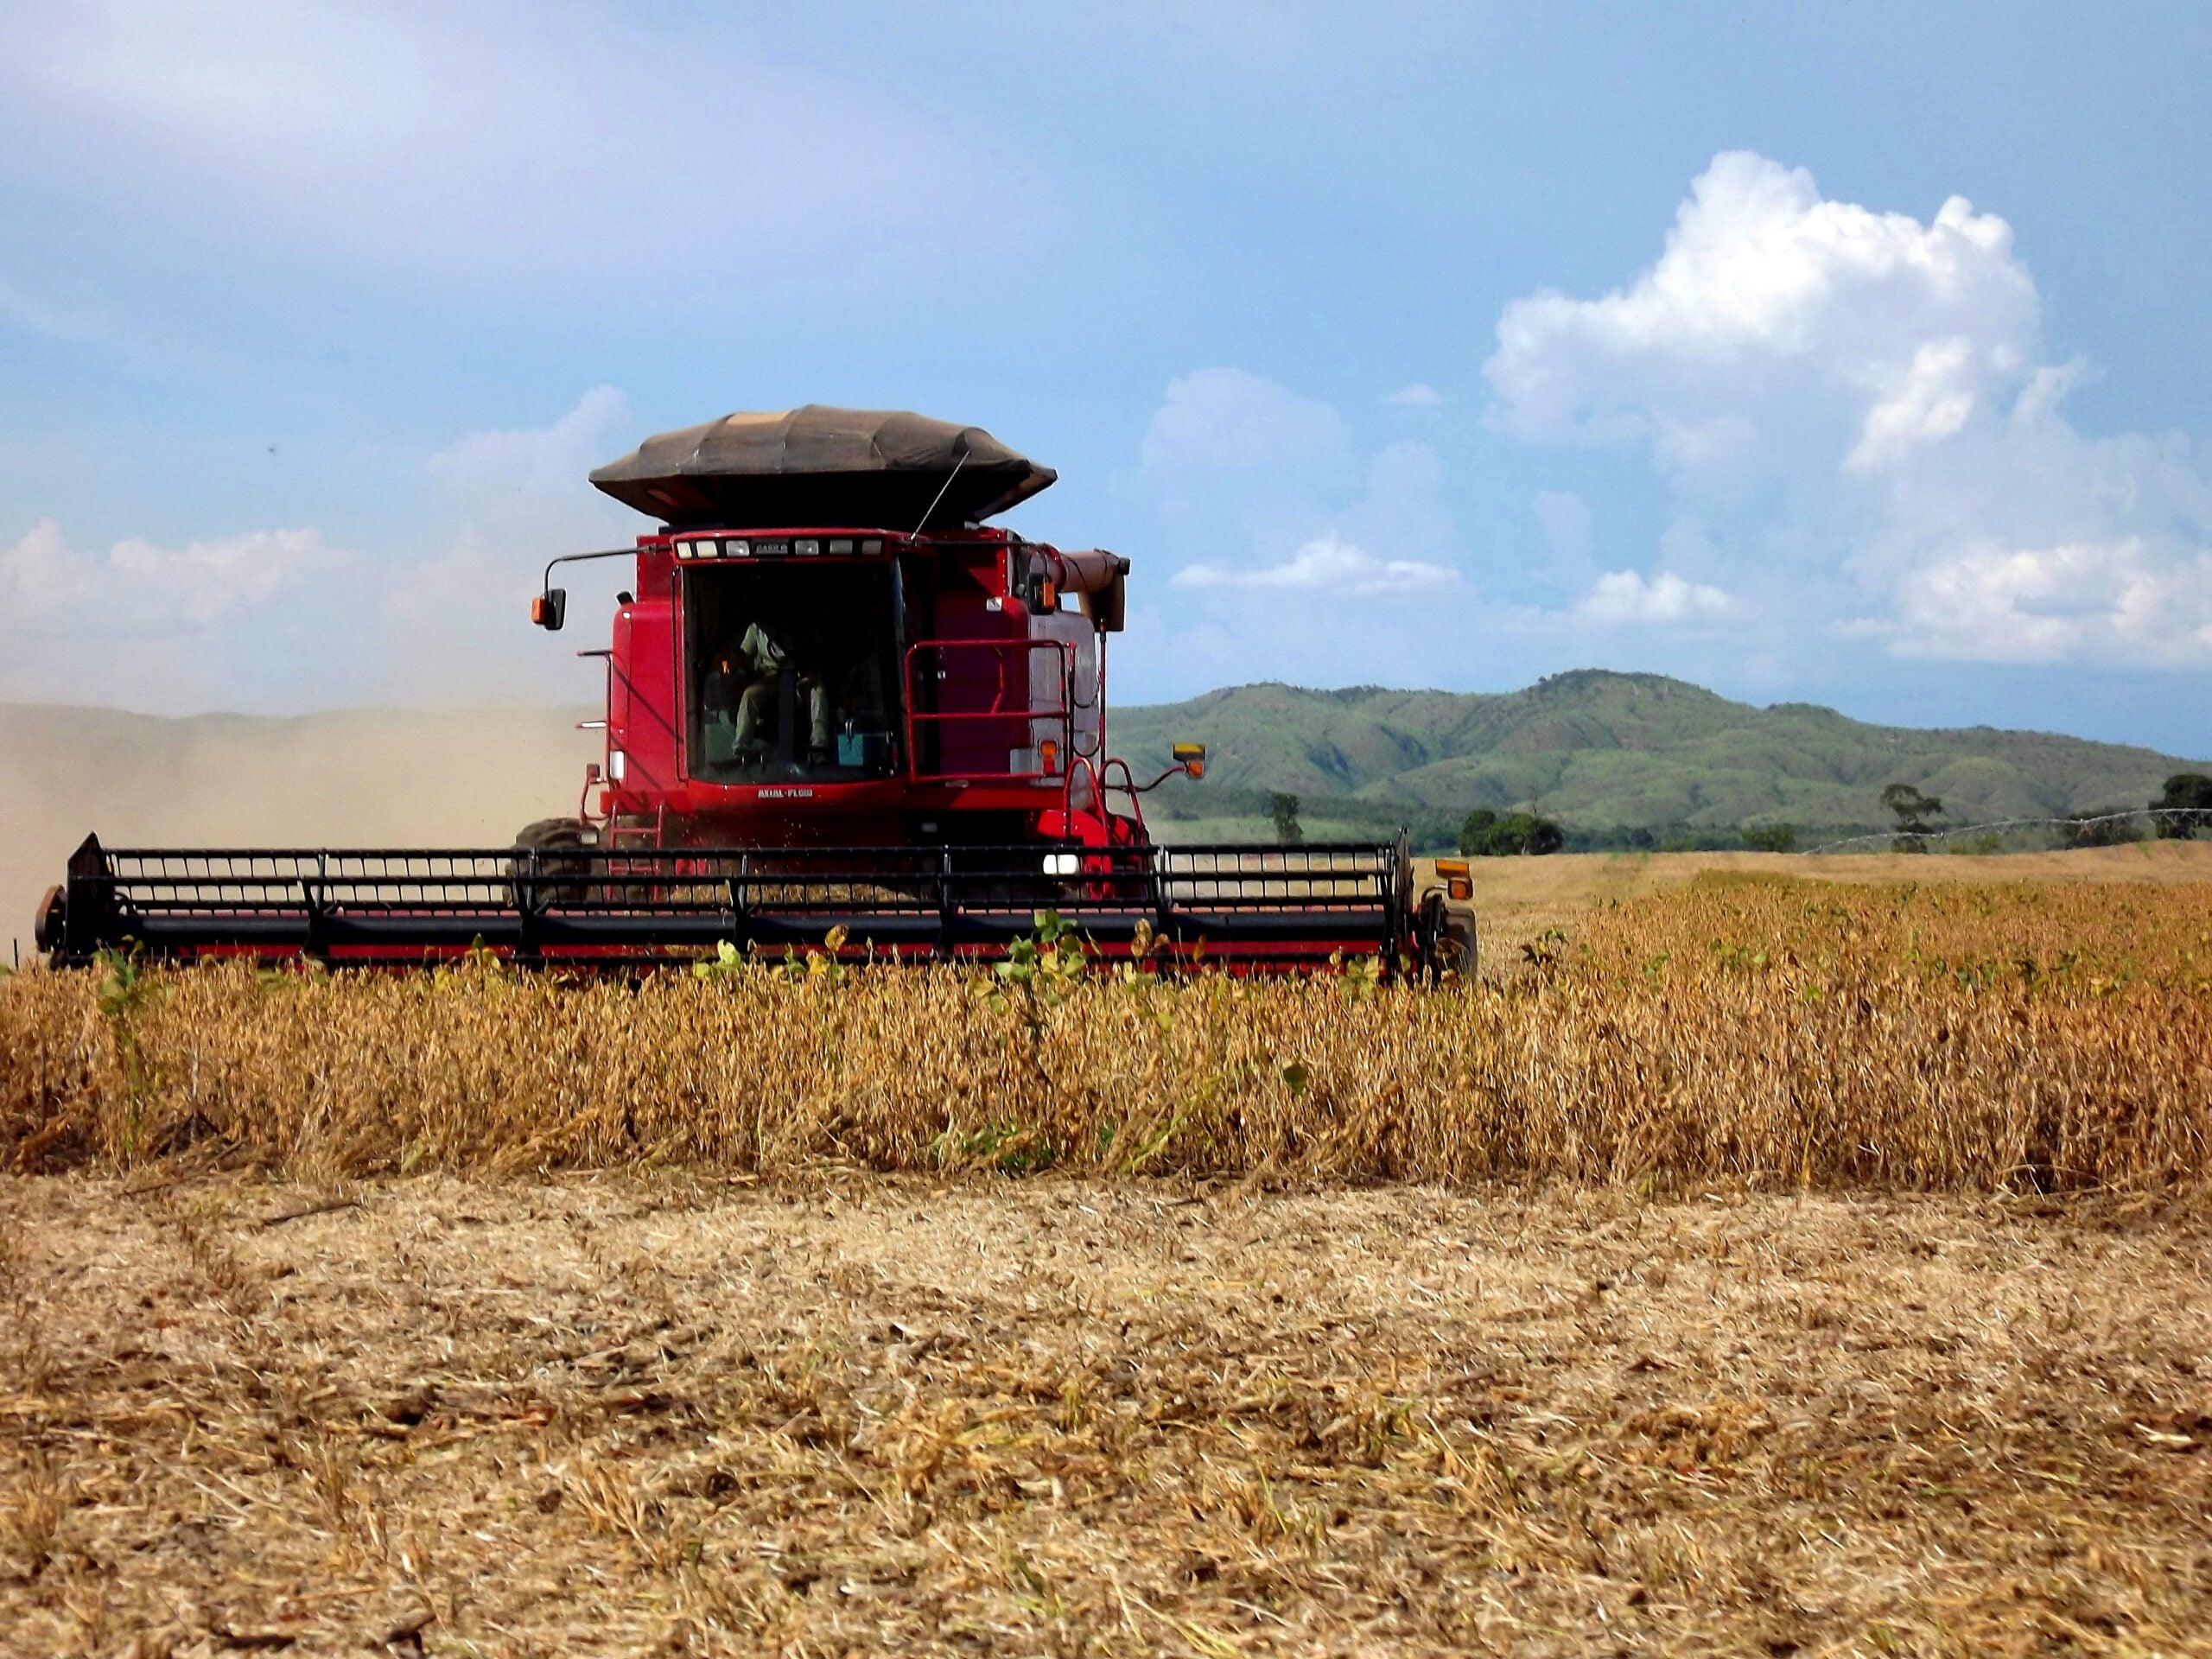
02 The board
Soybeans were the strongest, with the SOYB fund up +2.78% to US$25.92. It was the first up day in a row, so the market has only just stopped falling.
Corn rose +1.11% to US$17.35 for the CORN fund, while the WEAT wheat fund added +0.46% to US$21.75. These funds track futures prices, not the cash price a farmer receives.
| Asset | Level | Change |
|---|---|---|
| Soybeans (SOYB) | US$25.92 | +2.78% |
| Corn (CORN) | US$17.35 | +1.11% |
| Wheat (WEAT) | US$21.75 | +0.46% |
Source: RT close, 2026-11-10. Where a commodity has no spot feed, an exchange-traded tracker or leading producer is shown as a labelled proxy.
Live Market IntelligenceThe live market board
Rio Times · Live Market Intelligence
Latin America — Cross-Market Board
| Instrument | Last | Change | YoY | Prev. | High | Low | Volume |
|---|---|---|---|---|---|---|---|
| IBOV | 171,336.99 | -0.52% | +10.36% | 172,236.05 | 173,272 | 170,569 | — |
| IPSA | 10,597.06 | +0.07% | — | 10,589.65 | 10,635 | 10,554 | — |
| IPC MEX | 71,564.96 | -0.42% | +13.95% | 71,866.30 | 72,057 | 71,295 | 202,220,399 |
| MERVAL | 2,848,945 | — | -10.97% | 2,859,051 | — | — | — |
| COLCAP | 2,528.01 | -1.88% | — | — | — | — | — |
| USD/BRL | 5.58 | +1.35% | +5.54% | 5.51 | 5.58 | 5.58 | — |
| EUR/BRL | 6.23 | +1.65% | +2.03% | 6.13 | 6.24 | 6.23 | — |
| USD/MXN | 18.60 | +0.36% | +1.21% | 18.53 | 18.62 | 18.60 | — |
| USD/CLP | 983.69 | +1.70% | +4.93% | 967.23 | 985.56 | 963.98 | — |
| USD/COP | 3,297 | +5.67% | -12.13% | 3,120 | 3,297 | 3,296 | — |
| USD/PEN | 3.41 | -0.06% | +2.98% | 3.41 | 3.41 | 3.41 | — |
| USD/ARS | 1,545 | -0.03% | +8.82% | 1,546 | 1,545 | 1,545 | — |
| USD/UYU | 40.43 | +3.52% | +2.92% | 39.06 | 40.43 | 40.43 | — |
| USD/PYG | 6,196 | +1.99% | -11.16% | 6,075 | 6,196 | 6,196 | — |
| USD/BOB | 11.68 | +0.19% | +72.65% | 11.66 | 11.68 | 11.68 | — |
| USD/DOP | 60.44 | +2.38% | -5.56% | 59.04 | 60.46 | 60.44 | — |
| USD/CRC | 445.62 | +1.24% | -9.10% | 440.16 | 445.62 | 445.62 | — |
| USD/GTQ | 7.64 | +2.97% | +1.90% | 7.42 | 7.64 | 7.64 | — |
03 Why it moved
The first and heaviest cause was the USDA report, with high confidence. It cut corn yields for a further month and lowered US stocks, and traders who had bet on a bigger supply had to buy back.
The second cause, at medium confidence, was exports. US soybean shipments have been strong, and Rabobank says China is moving some purchases to the US after a trade agreement.
The conflicting signal came from the macro backdrop. The US dollar index rose 0.55% to 102.22 and the 10-year Treasury yield jumped 10 basis points to 4.99%, which normally weighs on commodities priced in dollars. Grains rose anyway, which tells us the farm-specific news outweighed the macro drag.
04 The trend behind it
SOYB sits 7.9% below its 10 September high and 19.4% above its 13 January low, while CORN is 5.3% above its 29 June low. Wheat has been weakest, down 10.46% over 20 sessions and 13.0% over 60.
This looks like a continuation of the autumn decline with a bounce inside it. Our own history since 2011 shows that after SOYB fell this much in 20 sessions, it was higher 20 sessions later in 31 of 52 cases, or 60%, with a median gain of 1.0% and a worst case of 7.4% lower. That is a record of what happened before, not a forecast.
05 What it means for Latin America
Brazil is the centre of the story. Conab expects a record 181.64 million tonnes of soybeans from 49.3 million hectares, while Rabobank, a Dutch agricultural bank, is more cautious at 178 million.
Planting was 53% complete by 29 October, according to AgRural, a Brazilian crop consultancy. A firmer dollar generally lifts what exporters earn in reais.
For Argentina, the world’s leading exporter of soymeal and soyoil, lower grain prices squeeze export tax revenue. Importers and food manufacturers across the region gain when prices fall, but a US supply scare like Tuesday’s gives back a little of that relief.
06 The names to watch
Watch the three trackers as proxies: SOYB for oilseeds, CORN for feed grain and WEAT for bread grain. Corn is the most stretched, still 14.5% below its 20.29 peak of 1 September.
Among companies, watch Brazil’s soybean traders and exporters, along with farm lenders, which are exposed to planting costs.
07 What would end it
For soybeans, the 12-month high of 28.14 is the upper marker and the 21.71 low of 13 January is the floor. Corn has support near 16.47 and wheat resistance at 28.00.
The next catalysts are Brazilian planting and rainfall updates, including the weather pattern El Niño. The next USDA monthly report in December will show whether the yield cuts continue. Honest answer: the bounce can last a few sessions, but a record Brazilian crop makes a sustained rally unlikely without a weather problem.
08 What to watch
- US supply: The next USDA monthly report in December will show whether corn yields are cut again.
- Brazil weather: Rain and El Niño during planting and early growth decide whether Conab’s record forecast holds.
- The dollar: A dollar index above 102 and a 10-year yield near 4.99% can cap any grain rally.
Frequently Asked Questions
Why did grain prices rise on 10 November 2026?
The USDA cut its US corn yield estimate and lowered its estimate of grain stocks, which made supply look tighter.
Why does Brazil matter for soybeans?
Conab estimated in October a record 181.64 million tonnes this season, and Brazil is the world’s biggest soybean exporter, so its crop sets global prices.
How big is Brazil’s soybean crop?
Conab estimated in October a record 181.64 million tonnes, while Rabobank, a Dutch agricultural bank, expects 178 million.
Are SOYB, CORN and WEAT the actual crop prices?
No. They are exchange-traded funds that track futures, so they follow the market but are not the price a farmer receives.
Market data: The Rio Times
This article was produced by The Rio Times’ automated AI newsroom. Editorial responsibility: Matthias Camenzind, Publisher and Editor-in-Chief. The Rio Times also runs Ask Rio Times, which answers from 100,000+ of our own articles, the daily Latin America Power Map, and prediction-market odds on elections and markets.. How we use AI · Report an error
LatAm Markets: Live Signals → — real-time movers, turnover leaders and FX across Latin America.