Copper Fund Falls 1.9% as Freeport Drops 2% | Copper Wrap, Nov 13

Key Facts
- Copper is at a three-month low: the CPER fund, which tracks copper futures rather than the metal itself, closed Friday, November 13, 2026 at US$36.53, down 1.91% on the day and on its fourth straight fall.
- The miners fell harder: Southern Copper, with mines in Peru, dropped 2.46% to US$164.08 and Freeport-McMoRan, a large US copper producer, lost 2.00% to US$59.24, both well below their August peaks.
- The main cause is money, not metal: the US 10-year Treasury yield rose 31 basis points in five sessions to 5.14%, and a firmer dollar makes dollar-priced copper dearer for foreign buyers.
- The distance from the peak is large: the copper fund sits 11.8% below its 22 September high of 41.43, yet still 18.7% above its November 2025 low of 30.77.
- Supply is not the problem: Chile’s state copper commission Cochilco expects Chilean output to fall 8.4% to 4.94 million tonnes in 2026, which cushions the price.
- History offers a coin-flip: after 33 earlier falls this large in our records, the fund was higher 20 sessions later 18 times, a 55% share; history is not a forecast.
- Prediction markets: Polymarket, a real-money prediction market, prices a 25.5% chance that copper cable is hit with US Section 232 tariffs (import duties imposed on national-security grounds) by 31 December 2026 and 60.0% by the end of 2027 (US$17,223 traded, 8:05 p.m. ET, 13 November).
Today’s Focus
Copper has fallen for four sessions in a row, and the fund that tracks its futures closed Friday, November 13, 2026 at its lowest level in at least three months. The miners that dig the metal in Chile and Peru fell further, with Southern Copper down 17.30% over 20 sessions.
The main cause is the cost of money. US government borrowing rates climbed to 5.14% and the dollar index firmed to 103.41, which pressures any asset priced in dollars and held without paying interest.
The odd part is that physical supply is tight: Chile’s output is forecast to shrink this year. That is why most of the pain is financial rather than industrial, and why it could reverse quickly if yields calm.
What matters today. Copper is being sold because money has become expensive, not because the world suddenly needs less of it, and that distinction decides whether this is a dip or a downturn.
01 The session in one read
Think of copper as the world’s electrical thermometer: it feeds wires, motors, cars and power grids, so investors read it as a gauge of industrial health. On Friday, November 13, 2026 that thermometer dropped again.
The CPER fund fell 1.91%, its fourth consecutive decline, and closed at its lowest level in at least three months. It is now 7.52% lower than 20 sessions ago.
The best-supported reading is that higher bond yields and a stronger dollar, drove funds to sell copper while supply stayed tight. The variable to watch is the US 10-year yield: while it stays near 5.14% or higher, rallies are likely to meet sellers.
02 The board
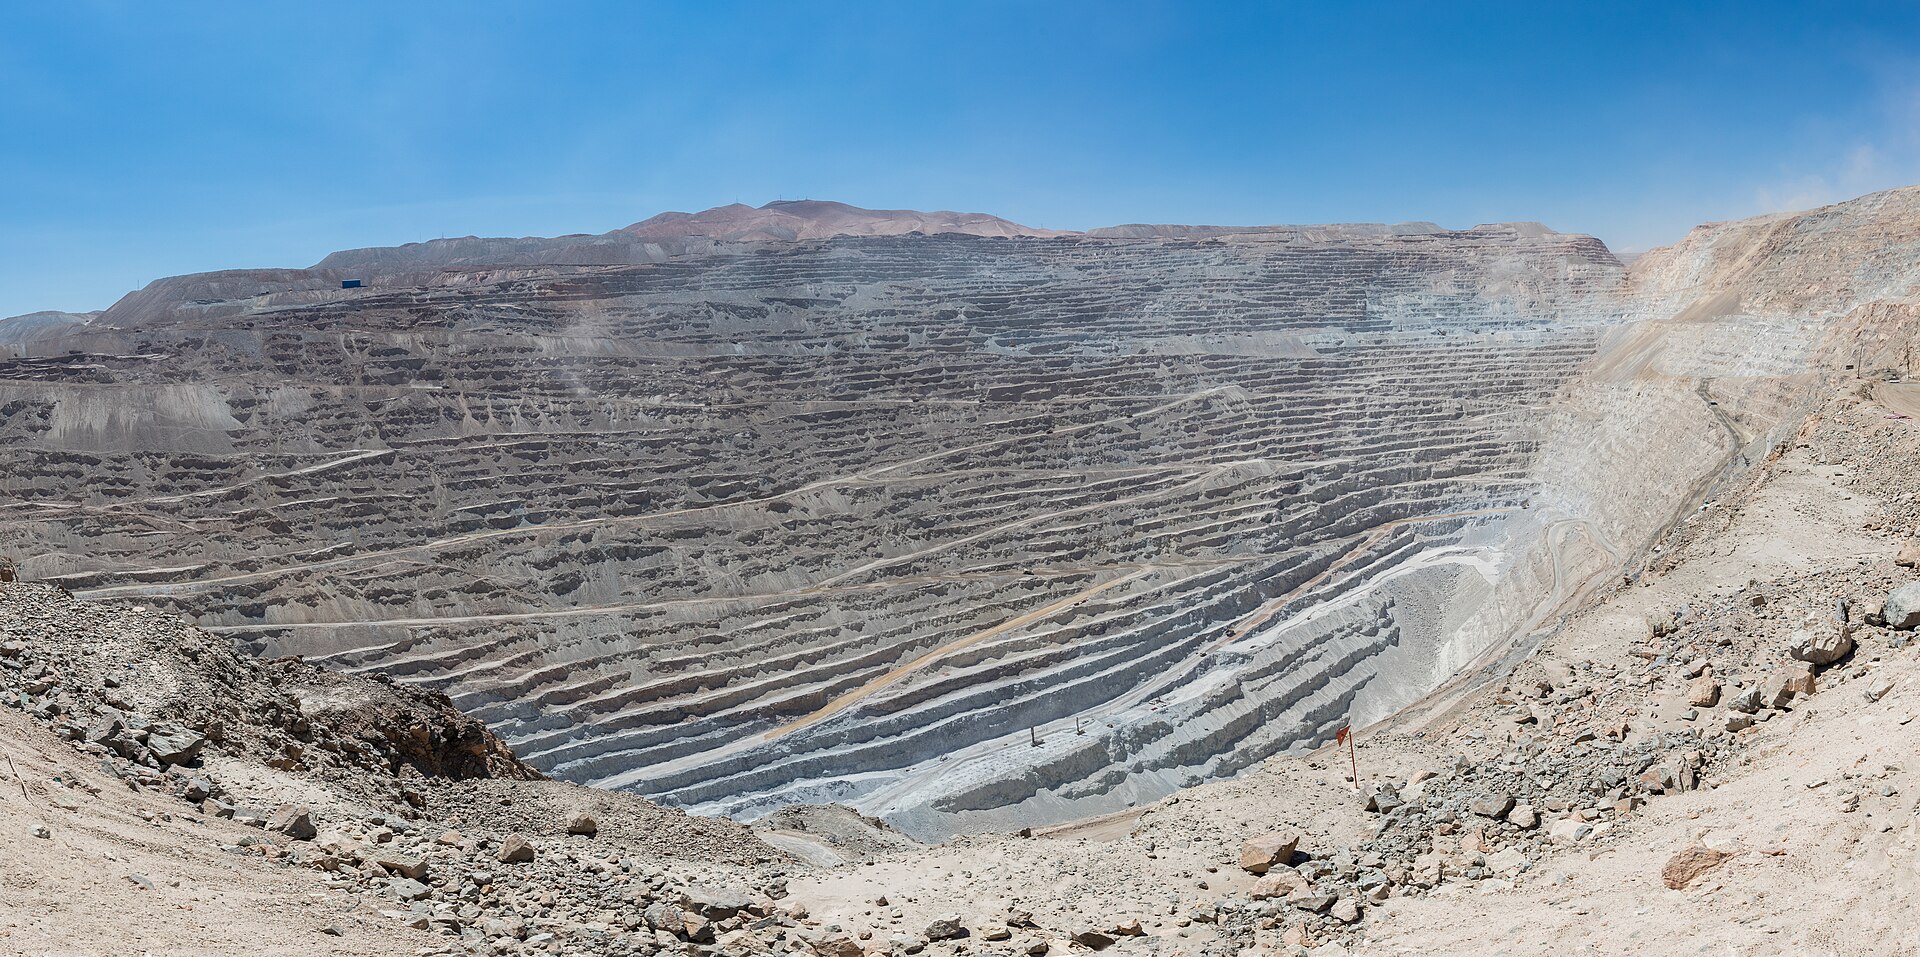
The two big miners told the same story with more force. Southern Copper, controlled from Mexico with its mines in Peru, closed at US$164.08 after falling 2.46%, and Freeport-McMoRan, the largest listed copper producer in the Americas, ended at US$59.24 after falling 2.00%.
Miners usually move more than the metal because their profits depend on the gap between price and cost. That leverage is visible: Southern Copper is 24.5% below its 25 August high of 217.40, against 11.8% for the copper fund.
| Asset | Level | Change |
|---|---|---|
| Copper (CPER tracker) | US$36.53 | -1.91% |
| Southern Copper | US$164.08 | -2.46% |
| Freeport-McMoRan | US$59.24 | -2.00% |
Source: RT close, 2026-11-13. Where a commodity has no spot feed, an exchange-traded tracker or leading producer is shown as a labelled proxy.
Live Market IntelligenceThe live market board
Rio Times · Live Market Intelligence
Latin America — Cross-Market Board
| Instrument | Last | Change | YoY | Prev. | High | Low | Volume |
|---|---|---|---|---|---|---|---|
| IBOV | 172,457.76 | +0.66% | +9.73% | 171,324.31 | 172,715 | 171,132 | — |
| IPSA | 10,660.94 | +0.34% | — | 10,625.19 | 10,699 | 10,624 | — |
| IPC MEX | 71,610.23 | -0.28% | +13.87% | 71,811.20 | 71,981 | 71,044 | 149,701,210 |
| MERVAL | 2,848,945 | — | -10.97% | 2,859,051 | — | — | — |
| COLCAP | 2,452.46 | -0.02% | — | — | — | — | — |
| USD/BRL | 5.67 | +0.45% | +7.09% | 5.64 | 5.67 | 5.63 | — |
| EUR/BRL | 6.25 | +0.93% | +1.93% | 6.19 | 6.26 | 6.21 | — |
| USD/MXN | 18.52 | -0.42% | +1.29% | 18.60 | 18.63 | 18.51 | — |
| USD/CLP | 994.16 | -0.13% | +6.95% | 995.48 | 1,002 | 993.78 | — |
| USD/COP | 3,302 | +0.70% | -10.86% | 3,279 | 3,331 | 3,302 | — |
| USD/PEN | 3.40 | -0.16% | +0.77% | 3.41 | 3.41 | 3.39 | — |
| USD/ARS | 1,544 | -0.11% | +9.58% | 1,545 | 1,548 | 1,543 | — |
| USD/UYU | 40.59 | +2.33% | +3.41% | 39.67 | 40.59 | 40.52 | — |
| USD/PYG | 6,196 | +2.33% | -10.79% | 6,055 | 6,196 | 6,185 | — |
| USD/BOB | 11.59 | -0.37% | +72.02% | 11.63 | 11.60 | 11.55 | — |
| USD/DOP | 60.59 | +1.85% | -5.40% | 59.49 | 60.61 | 60.27 | — |
| USD/CRC | 442.74 | -0.10% | -9.70% | 443.16 | 445.25 | 442.74 | — |
| USD/GTQ | 7.64 | +2.06% | +2.02% | 7.49 | 7.65 | 7.64 | — |
03 Why it moved
First cause, and the heaviest: the price of money. The US 10-year yield stands at 5.14%, up 31 basis points over five sessions (a basis point is one hundredth of a percentage point), and the dollar index has gained 1.09% in the same time.
Gold tells the same story. Its fund, GLD, is down 4.58% over five sessions amid bets that the Federal Reserve may raise rates again, and copper has been swept along.
Conflicting signal: the S&P 500 is 2.51% higher over five sessions and the fear gauge VIX has fallen 24.73% in that time, so this is not a general panic. Oil, tracked by the USO fund, is down 1.91% over the same five sessions, which hints at soft industrial appetite.
Confidence is medium. Rates and the dollar fit the timing well, though we cannot measure how much each contributed.
From the RT economic calendar: US producer prices rose 0.3% in October against 0.4% expected, and the core measure, which strips out food and energy, rose 0.3% as forecast, or 5.0% on the year. The 10-year Treasury yield still rose to 5.14%, so the milder headline reading did not ease the pressure. China, which buys most of the world’s refined copper, had no major calendar release on Friday.
04 The trend behind it
The fall is not new. The copper fund has lost 7.2% over 60 sessions and is 11.8% below its 22 September high of 41.43, so this is a continuation of a slide that began in the autumn, not a fresh shock.
The longer picture remains kinder: the fund is still 18.7% above its November 2025 low of 30.77. Southern Copper is 42.4% above its own low of 115.21 and Freeport is 51.9% above its low of 39.00, so the year’s gains have been trimmed, not erased.
Our own history adds a sober note. In 33 earlier cases since 2011 when the fund fell at least this much in 20 sessions, it was higher 20 sessions later in 18 cases, with a median gain of 1.5% and a worst loss of 16.2%; that is a record, not a forecast.
05 What it means for Latin America
Chile is the world’s largest copper producer and Peru the second. Cochilco, Chile’s state copper commission, forecasts Chilean output falling 8.4% to 4.94 million tonnes in 2026, then recovering 3% to 5.08 million in 2027, while Peru is expected to grow only about 0.5%.
That is the awkward combination for the two countries: less metal to sell and a lower price for what they do sell. Tax receipts and the Chilean peso and Peruvian sol, which tend to track copper, are the channels to watch.
06 The names to watch
Southern Copper, with its Peruvian mines, has fallen 17.30% over 20 sessions, more than the 14.81% drop at Freeport-McMoRan over the same stretch. Southern Copper also closed at its lowest in at least three months.
Freeport, with large mines in Indonesia and the United States, is the cleaner bet on the price of the metal. Both stocks have fallen 2 sessions in a row, and both have a history of mixed results after falls this size: Freeport was higher 20 sessions later in 31 of 58 earlier cases.
07 What would end it
The nearest support for the copper fund is the 12-month low of 30.77, a long way below, so near-term the line to watch is the recent closing low at today’s 36.53. Resistance is the 22 September high of 41.43, and a recovery would have to climb back through the round 40 mark first.
The dated catalysts are the next US inflation report and the Federal Reserve’s December meeting, since both set the path of yields. The honest answer to whether it stops is: it stops when the 10-year yield stops rising, or when Chinese buying visibly picks up.
08 What to watch
- US 10-year yield: Currently 5.14%; a retreat would remove the main weight on copper and the miners.
- US dollar index: At 103.41 after a 1.09% gain in five sessions; a weaker dollar makes copper cheaper for buyers abroad.
- Chinese demand: China is the world’s largest buyer of refined copper, so import and factory data are the swing factor.
- Chilean output: Cochilco’s forecast of a 8.4% fall to 4.94 million tonnes in 2026 is the supply cushion under the price.
What Prediction Markets Say
Polymarket, where users bet real money, lists a market on US Section 232 tariffs (import duties imposed on national-security grounds) on copper cable, with US$17,223 traded as of 8:05 p.m. ET, 13 November 2026. It prices a 25.5% chance by 31 December 2026 and a 60.0% chance by 31 December 2027.
These prices are bets, not polls. They show traders see tariffs on copper products as more likely than not over the next year or so, though not before the end of this year.
Why we show this: prediction markets turn real-money bets into a live probability that moves within minutes of the news, which is why investors, campaigns and newsrooms in the United States now follow them closely. We show them next to polls and official results, never instead of them.
Frequently Asked Questions
Why is copper falling if supply is tight?
Because the selling is financial: higher US yields at 5.14% and a firmer dollar pushed funds out of copper, while the physical shortage is a slower story.
Does CPER show the price of copper itself?
No. CPER tracks copper futures contracts, so its price is a proxy that can differ from the spot price paid for physical metal.
Which countries are hurt most?
Chile and Peru, the world’s two largest producers, face both lower prices and, in Chile’s case, a forecast 8.4% fall in output.
Is this a buying opportunity?
History is evenly split: in 33 earlier similar falls the fund was higher 20 sessions later 18 times, but the worst case was a further 16.2% loss, and none of this is advice.
Market data: The Rio Times
This article was produced by The Rio Times’ automated AI newsroom. Editorial responsibility: Matthias Camenzind, Publisher and Editor-in-Chief. The Rio Times also runs Ask Rio Times, which answers from 100,000+ of our own articles, the daily Latin America Power Map, and prediction-market odds on elections and markets.. How we use AI · Report an error
LatAm Markets: Live Signals → — real-time movers, turnover leaders and FX across Latin America.
Read More from The Rio Times