IBOV 186,316.10 ▲ 0.41% IPSA 11,381.18 ▲ 1.30% IPC MEX 63,507.11 ▼ 1.11% MERVAL 3,046,139 ▲ 0.57% COLCAP 2,510.93 ▼ 0.03% BVL PERÚ 58,965.05 ▲ 0.64% USD/BRL5.15— 0.00% USD/MXN17.19▼ 0.33% USD/CLP958.78▲ 0.35% USD/COP3,149▲ 0.85% USD/PEN3.36▼ 0.04% USD/ARS1,509▼ 0.25% USD/UYU40.20▲ 3.11% USD/PYG5,888▲ 2.09% USD/BOB9.75▼ 12.91% USD/DOP58.83▼ 0.03% USD/CRC444.45▲ 2.53% USD/GTQ7.63▲ 3.11% USD/HNL26.85▲ 3.22% USD/NIO36.62▲ 2.69% USD/VES845.33▼ 0.13% USD/PAB1.00— 0.00% USD/BZD2.00— 0.00% USD/JMD 157.28 — 0.00% USD/TTD6.74▲ 2.56% EUR/BRL5.91▼ 0.24% BRENT 88.88 ▼ 0.03% WTI 83.11 ▼ 0.11% IRON ORE 161.91 — — COPPER 6.61 ▲ 0.03% GOLD 4,461 ▲ 1.78% SILVER 65.59 ▲ 1.26% SOY 1,184 ▲ 3.20% CORN 480.50 ▲ 10.02% WHEAT 655.00 ▲ 3.93% COFFEE 317.25 ▼ 5.51% SUGAR 16.43 ▼ 1.79% ORANGE JUICE 138.55 ▼ 0.47% COTTON 85.03 ▲ 2.33% COCOA 5,719 ▲ 3.18% BEEF 223.60 ▼ 3.93% CATTLE 339.10 ▼ 3.16% LITHIUM 75.20 ▲ 1.47% PETR4 41.64 ▼ 0.05% VALE3 72.97 ▲ 0.83% ITUB4 38.60 ▼ 1.03% BBDC4 16.85 ▲ 0.36% ABEV3 14.89 ▼ 0.80% BBAS3 19.37 ▲ 0.47% B3SA3 14.26 ▼ 0.21% WEGE3 47.59 ▲ 0.49% PRIO3 59.14 ▼ 0.19% SUZB3 41.33 ▲ 2.35% RENT3 34.68 ▼ 0.09% AZZA3 15.89 ▼ 2.63% CSAN3 3.22 ▼ 1.83% RAIZ4 0.25 — 0.00% PCAR3 2.75 ▼ 0.36% GMAT3 3.65 ▼ 1.08% PSSA3 48.13 ▼ 0.54% CVCB3 1.33 ▼ 2.92% POSI3 3.36 ▲ 2.44% SLCE3 13.34 ▲ 0.30% NATU3 8.14 ▼ 0.73% IBOV 186,316.10 ▲ 0.41% IPSA 11,381.18 ▲ 1.30% IPC MEX 63,507.11 ▼ 1.11% MERVAL 3,046,139 ▲ 0.57% COLCAP 2,510.93 ▼ 0.03% BVL PERÚ 58,965.05 ▲ 0.64% USD/BRL 5.16 ▲ 0.01% USD/MXN 17.06 ▼ 0.24% USD/CLP 913.98 ▲ 0.04% USD/COP 3,140 ▲ 0.03% USD/PEN 3.36 ▼ 0.66% USD/ARS 1,493 ▲ 0.10% USD/UYU 40.27 ▲ 1.24% USD/PYG 5,939 ▲ 1.68% USD/BOB 11.64 ▼ 0.76% USD/DOP 58.34 ▲ 1.25% USD/CRC 445.92 ▲ 0.89% USD/GTQ 7.62 ▲ 2.21% USD/HNL 26.79 ▲ 1.57% USD/NIO 36.62 ▲ 0.69% USD/VES 762.44 ▼ 0.13% USD/PAB 1.00 — 0.00% USD/BZD 2.00 — 0.00% USD/JMD 157.28 — 0.00% USD/TTD 6.70 ▲ 0.61% EUR/BRL 5.95 ▲ 1.01% BRENT 88.88 ▼ 0.03% WTI 83.11 ▼ 0.11% IRON ORE 161.91 — — COPPER 6.61 ▲ 0.03% GOLD 4,461 ▲ 1.78% SILVER 65.59 ▲ 1.26% SOY 1,184 ▲ 3.20% CORN 480.50 ▲ 10.02% WHEAT 655.00 ▲ 3.93% COFFEE 317.25 ▼ 5.51% SUGAR 16.43 ▼ 1.79% ORANGE JUICE 138.55 ▼ 0.47% COTTON 85.03 ▲ 2.33% COCOA 5,719 ▲ 3.18% BEEF 223.60 ▼ 3.93% CATTLE 339.10 ▼ 3.16% LITHIUM 75.20 ▲ 1.47% PETR4 41.64 ▼ 0.05% VALE3 72.97 ▲ 0.83% ITUB4 38.60 ▼ 1.03% BBDC4 16.85 ▲ 0.36% ABEV3 14.89 ▼ 0.80% BBAS3 19.37 ▲ 0.47% B3SA3 14.26 ▼ 0.21% WEGE3 47.59 ▲ 0.49% PRIO3 59.14 ▼ 0.19% SUZB3 41.33 ▲ 2.35% RENT3 34.68 ▼ 0.09% AZZA3 15.89 ▼ 2.63% CSAN3 3.22 ▼ 1.83% RAIZ4 0.25 — 0.00% PCAR3 2.75 ▼ 0.36% GMAT3 3.65 ▼ 1.08% PSSA3 48.13 ▼ 0.54% CVCB3 1.33 ▼ 2.92% POSI3 3.36 ▲ 2.44% SLCE3 13.34 ▲ 0.30% NATU3 8.14 ▼ 0.73%
since 2009
Thursday, September 17, 2026

World-News Europe and Russia

Copenhagen Tops Global Liveability List as Europe Leads the Way

By · June 17, 2025 · 2 min read

The LatAm Brief

One email, every weekday morning. What moved in Latin American markets, politics and expat life.

Yesterday’s subject line: “The Fed raised. Brazil cut, four hours later.”

Free. We send a confirmation link first — nothing arrives until you click it. Unsubscribe with one click in any edition. If you stop opening us for 30 days we stop sending by ourselves, as we assume the interest is no longer there. See our privacy policy. We never share your email.

Copenhagen is now ranked the world’s most liveable city, according to the 2025 Economist Intelligence Unit Global Liveability Index. For the first time in years, Vienna lost its top spot, dropping to second place after security concerns affected its score.

Zurich remains steady in third, confirming Europe’s dominance in offering high living standards. The EIU index examines 173 cities worldwide, measuring stability, healthcare, education, infrastructure, and environment. Copenhagen scored 98 out of 100.

The city’s strong public safety, clean environment, and reliable infrastructure helped it reach the top. Zurich, in third, stands out for its robust public transport and high-quality education.

Vienna’s drop resulted from recent security incidents, including a bomb threat at a major train station and a foiled attack during a concert event. These events lowered Vienna’s stability score, despite the city maintaining high marks in education, healthcare, and infrastructure.

Europe’s cities continue to set the global standard, with Geneva also in the top five. Melbourne is the only non-European city in the top five, while Sydney and Adelaide from Australia also secure places in the top ten.
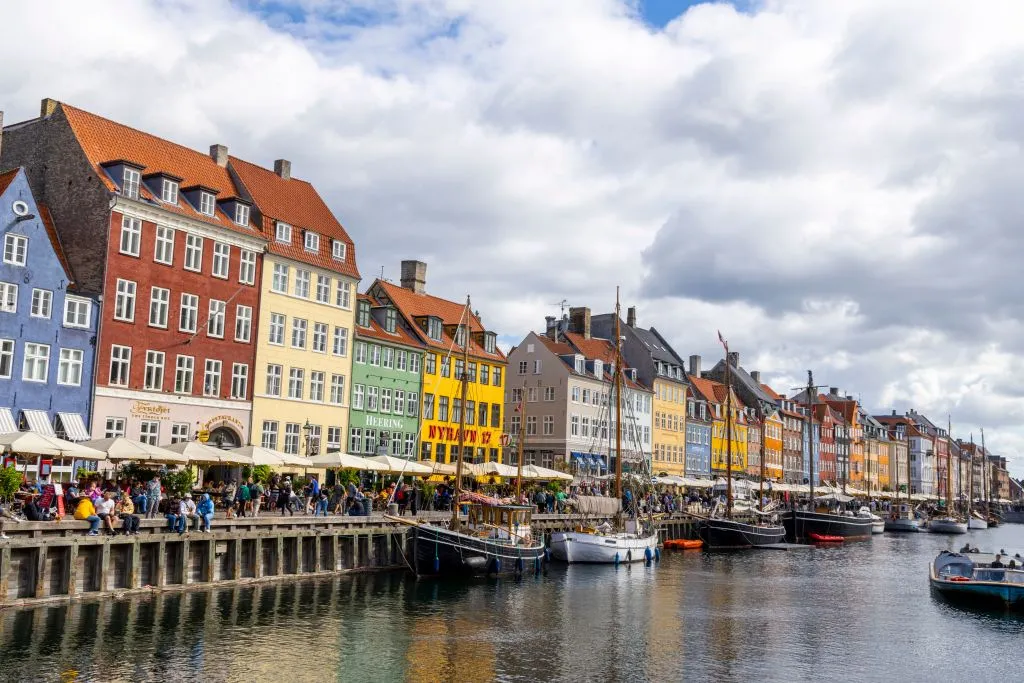
Copenhagen Tops Global Liveability List as Europe Leads the Way
Copenhagen Tops Global Liveability List as Europe Leads the Way.
One-stop reference
Company Intelligence
Every listed company in Latin America — financials, ownership and structure for 1,450+ companies across 26 exchanges, in one place.
Browse the directory →
RT
Ask Rio Times
17 years of Latin America reporting, on demand.
Open the full Ask Rio Times →

Vancouver is now the highest-ranking city in North America, as other Canadian cities dropped due to healthcare system strains and increased instability.

Europe’s Liveability Lead vs. Latin America’s Ongoing Challenges

The index shows a clear gap between Europe and Latin America. No Latin American city appears near the top. High crime, weak infrastructure, and limited access to quality healthcare keep these cities far from leading the list.

The challenges in Latin American cities highlight persistent issues in safety and public services, making it difficult for them to compete with the world’s best.

The EIU uses both data and expert assessments to score cities. Each city receives a score from 1 (intolerable) to 100 (ideal), offering a clear benchmark for comparison.

The methodology ensures that only hard facts and consistent criteria determine the rankings. Businesses and investors pay attention to these results. High-ranking cities attract talent, investment, and international companies.

Strong scores in stability and infrastructure signal that businesses can operate efficiently and safely. Cities with lower rankings face more challenges in attracting skilled workers and investment.

The 2025 index confirms that Europe’s leading cities continue to provide the best conditions for residents and businesses. At the same time, cities in Latin America still struggle with basic issues that prevent them from rising in the rankings.

This article was produced by The Rio Times’ automated newsroom system. How we use AI · Report an error

Read More from The Rio Times

The Rio Times · Power Map
See who really holds power in Latin America
Click to open the Power Map

Rotate for Best Experience

This report is optimized for landscape viewing. Rotate your phone for the full experience.