IBOV 185,229.17 ▼ 0.41% IPSA 11,381.18 ▲ 1.30% IPC MEX 63,375.93 ▼ 0.78% MERVAL 3,021,926 ▼ 1.29% COLCAP 2,548.22 ▲ 1.05% BVL PERÚ 60,023.65 ▼ 1.13% USD/BRL5.14▲ 0.02% USD/MXN17.22▼ 0.01% USD/CLP959.00▼ 0.31% USD/COP3,175— 0.00% USD/PEN3.37▼ 0.01% USD/ARS1,514— 0.00% USD/UYU40.16▲ 2.99% USD/PYG5,906▲ 3.00% USD/BOB9.95▲ 1.26% USD/DOP58.83▲ 2.40% USD/CRC444.45▲ 2.50% USD/GTQ7.63▲ 3.11% USD/HNL26.85▲ 3.16% USD/NIO36.62— 0.00% USD/VES847.44▼ 0.13% USD/PAB1.00— 0.00% USD/BZD2.00— 0.00% USD/JMD 157.28 — 0.00% USD/TTD6.75▲ 2.45% EUR/BRL5.91▲ 0.04% BRENT 88.88 ▼ 0.03% WTI 83.11 ▼ 0.11% IRON ORE 161.91 — — COPPER 6.61 ▲ 0.03% GOLD 4,461 ▲ 1.78% SILVER 65.59 ▲ 1.26% SOY 1,184 ▲ 3.20% CORN 480.50 ▲ 10.02% WHEAT 655.00 ▲ 3.93% COFFEE 317.25 ▼ 5.51% SUGAR 16.43 ▼ 1.79% ORANGE JUICE 138.55 ▼ 0.47% COTTON 85.03 ▲ 2.33% COCOA 5,719 ▲ 3.18% BEEF 223.60 ▼ 3.93% CATTLE 339.10 ▼ 3.16% LITHIUM 75.20 ▲ 1.47% PETR4 41.64 ▼ 0.05% VALE3 72.97 ▲ 0.83% ITUB4 38.60 ▼ 1.03% BBDC4 16.85 ▲ 0.36% ABEV3 14.89 ▼ 0.80% BBAS3 19.37 ▲ 0.47% B3SA3 14.26 ▼ 0.21% WEGE3 47.59 ▲ 0.49% PRIO3 59.14 ▼ 0.19% SUZB3 41.33 ▲ 2.35% RENT3 34.68 ▼ 0.09% AZZA3 15.89 ▼ 2.63% CSAN3 3.22 ▼ 1.83% RAIZ4 0.25 — 0.00% PCAR3 2.75 ▼ 0.36% GMAT3 3.65 ▼ 1.08% PSSA3 48.13 ▼ 0.54% CVCB3 1.33 ▼ 2.92% POSI3 3.36 ▲ 2.44% SLCE3 13.34 ▲ 0.30% NATU3 8.14 ▼ 0.73% IBOV 185,229.17 ▼ 0.41% IPSA 11,381.18 ▲ 1.30% IPC MEX 63,375.93 ▼ 0.78% MERVAL 3,021,926 ▼ 1.29% COLCAP 2,548.22 ▲ 1.05% BVL PERÚ 60,023.65 ▼ 1.13% USD/BRL 5.16 ▲ 0.01% USD/MXN 17.06 ▼ 0.24% USD/CLP 913.98 ▲ 0.04% USD/COP 3,140 ▲ 0.03% USD/PEN 3.36 ▼ 0.66% USD/ARS 1,493 ▲ 0.10% USD/UYU 40.27 ▲ 1.24% USD/PYG 5,939 ▲ 1.68% USD/BOB 11.64 ▼ 0.76% USD/DOP 58.34 ▲ 1.25% USD/CRC 445.92 ▲ 0.89% USD/GTQ 7.62 ▲ 2.21% USD/HNL 26.79 ▲ 1.57% USD/NIO 36.62 ▲ 0.69% USD/VES 762.44 ▼ 0.13% USD/PAB 1.00 — 0.00% USD/BZD 2.00 — 0.00% USD/JMD 157.28 — 0.00% USD/TTD 6.70 ▲ 0.61% EUR/BRL 5.95 ▲ 1.01% BRENT 88.88 ▼ 0.03% WTI 83.11 ▼ 0.11% IRON ORE 161.91 — — COPPER 6.61 ▲ 0.03% GOLD 4,461 ▲ 1.78% SILVER 65.59 ▲ 1.26% SOY 1,184 ▲ 3.20% CORN 480.50 ▲ 10.02% WHEAT 655.00 ▲ 3.93% COFFEE 317.25 ▼ 5.51% SUGAR 16.43 ▼ 1.79% ORANGE JUICE 138.55 ▼ 0.47% COTTON 85.03 ▲ 2.33% COCOA 5,719 ▲ 3.18% BEEF 223.60 ▼ 3.93% CATTLE 339.10 ▼ 3.16% LITHIUM 75.20 ▲ 1.47% PETR4 41.64 ▼ 0.05% VALE3 72.97 ▲ 0.83% ITUB4 38.60 ▼ 1.03% BBDC4 16.85 ▲ 0.36% ABEV3 14.89 ▼ 0.80% BBAS3 19.37 ▲ 0.47% B3SA3 14.26 ▼ 0.21% WEGE3 47.59 ▲ 0.49% PRIO3 59.14 ▼ 0.19% SUZB3 41.33 ▲ 2.35% RENT3 34.68 ▼ 0.09% AZZA3 15.89 ▼ 2.63% CSAN3 3.22 ▼ 1.83% RAIZ4 0.25 — 0.00% PCAR3 2.75 ▼ 0.36% GMAT3 3.65 ▼ 1.08% PSSA3 48.13 ▼ 0.54% CVCB3 1.33 ▼ 2.92% POSI3 3.36 ▲ 2.44% SLCE3 13.34 ▲ 0.30% NATU3 8.14 ▼ 0.73%
since 2009
Sunday, September 20, 2026

World-News China

China’s May Trade Data Reveal Export Slowdown and Import Decline

By · June 9, 2025 · 2 min read

The LatAm Brief

One email, every weekday morning. What moved in Latin American markets, politics and expat life.

Yesterday’s subject line: “Bolivia's 83% fuel shock, hours after the IMF loan”

Free. We send a confirmation link first — nothing arrives until you click it. Unsubscribe with one click in any edition. If you stop opening us for 30 days we stop sending by ourselves, as we assume the interest is no longer there. See our privacy policy. We never share your email.

China’s official customs data for May 2025 reveal a sharp shift in its trade dynamics. Exports grew 4.8% year-on-year to $316.1 billion, missing expectations and slowing from April’s 8.1% rise.

Imports fell 3.4%, a much steeper decline than forecast, highlighting weak domestic demand and persistent caution among Chinese consumers and businesses.

The trade surplus widened to $103.2 billion, up from April’s $96.18 billion. This surplus grew not because of strong export momentum, but because imports dropped even faster than exports grew.

The figures reflect the ongoing impact of U.S. tariffs, which reached as high as 145% in April before a temporary truce in May led both countries to suspend most duties. Even with this truce, the effects of earlier tariffs lingered.

Exports to the U.S. saw their steepest monthly drop in over five years, down more than 34% in May. In contrast, shipments to Southeast Asia and the European Union increased, helping offset the loss of U.S. business.
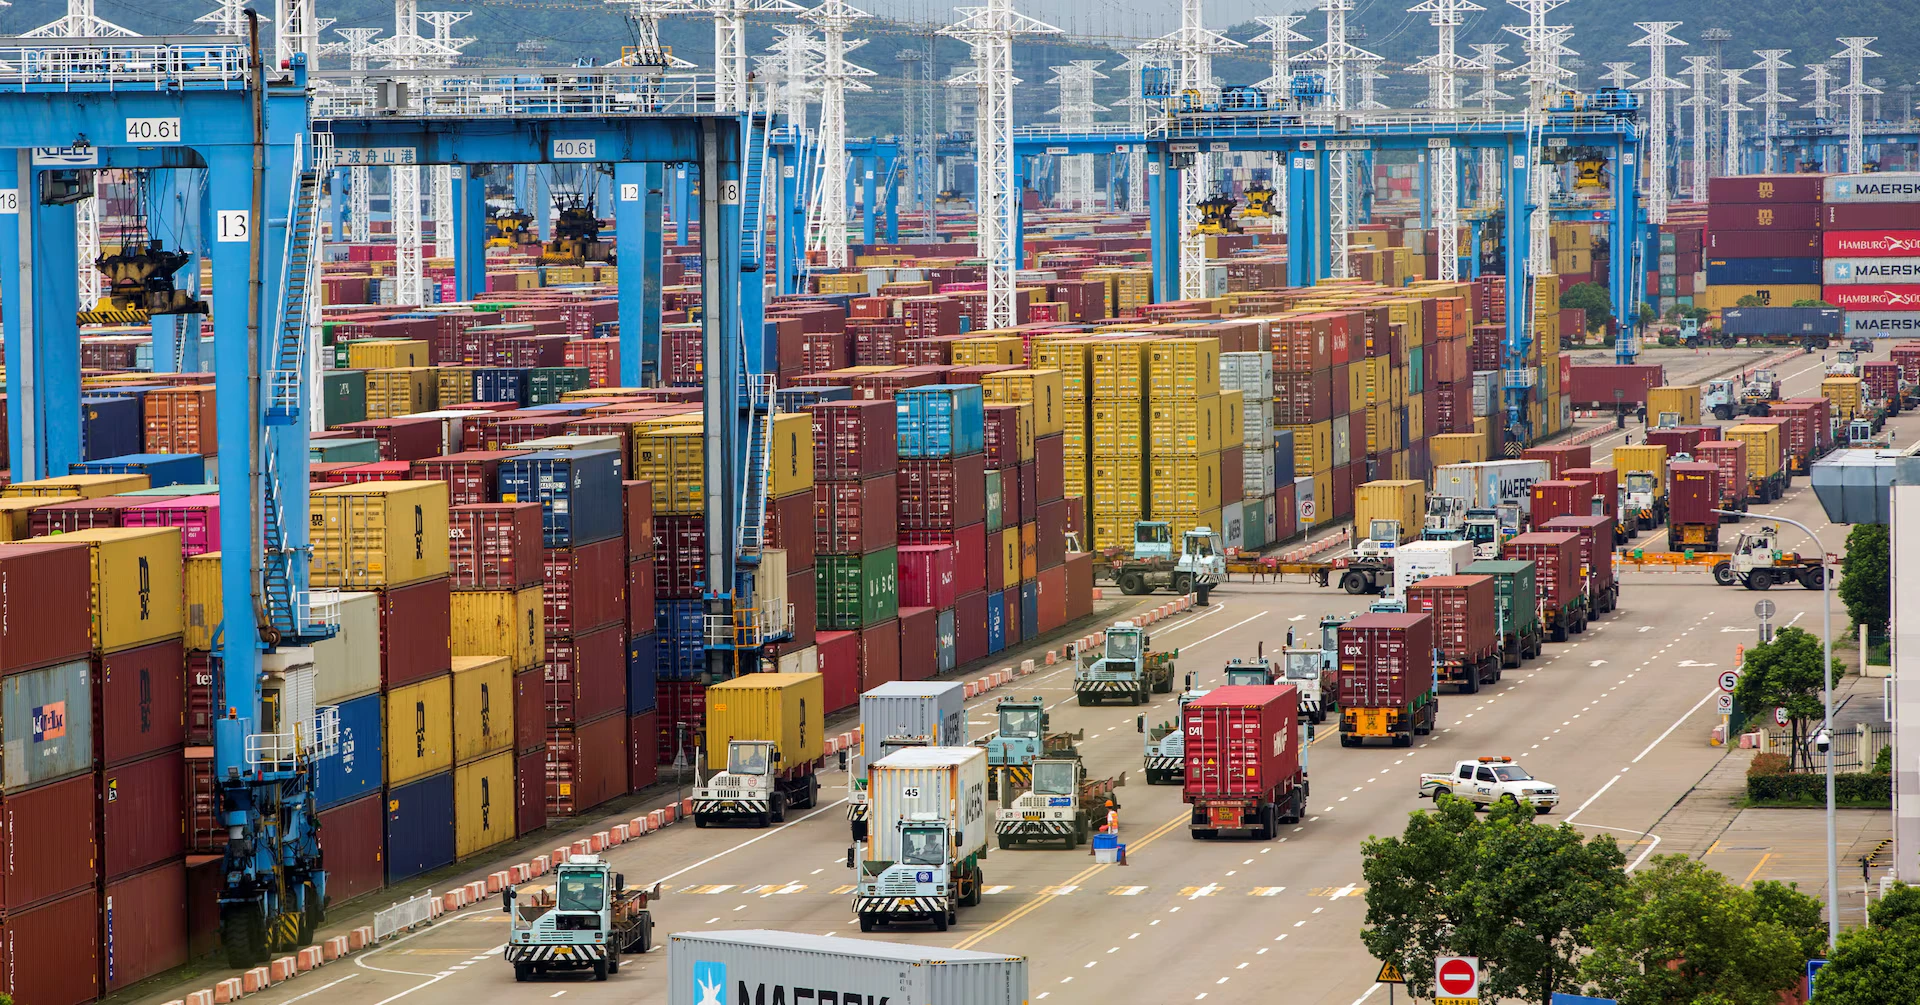
China’s May Trade Data Reveal Export Slowdown and Import Decline
China’s May Trade Data Reveal Export Slowdown and Import Decline.
One-stop reference
Company Intelligence
Every listed company in Latin America — financials, ownership and structure for 1,450+ companies across 26 exchanges, in one place.
Browse the directory →
RT
Ask Rio Times
17 years of Latin America reporting, on demand.
Open the full Ask Rio Times →

China’s imports of key commodities such as crude oil, coal, iron ore, and copper all declined in May. Natural gas imports rose slightly from April but remained 11% below last year’s level.

These trends underscore concerns about the health of China’s economy, as lower imports signal subdued manufacturing and consumer activity. Both nations plan further trade talks, but the business environment remains tense.

For global companies, China’s trade data show the risks of relying on a single market and the growing importance of diversifying supply chains and export destinations.

This article was produced by The Rio Times’ automated newsroom system. How we use AI · Report an error

Read More from The Rio Times

The Rio Times · Power Map
See who really holds power in Latin America
Click to open the Power Map

Rotate for Best Experience

This report is optimized for landscape viewing. Rotate your phone for the full experience.