IBOV 183,476.86 ▼ 0.27% IPSA 11,256.80 ▼ 0.38% IPC MEX 64,992.23 ▲ 1.13% MERVAL 2,893,751 ▼ 1.57% COLCAP 2,584.72 ▼ 0.95% BVL PERÚ 59,934.37 ▲ 1.27% USD/BRL5.19▼ 0.12% USD/MXN17.68▼ 0.27% USD/CLP960.63▼ 0.27% USD/COP3,293▲ 0.20% USD/PEN3.39▼ 0.67% USD/ARS1,525▲ 0.30% USD/UYU40.21▲ 3.50% USD/PYG5,870▲ 2.23% USD/BOB12.17▲ 2.05% USD/DOP59.35▲ 0.25% USD/CRC450.87▲ 2.53% USD/GTQ7.64▲ 3.22% USD/HNL26.85▲ 0.31% USD/NIO36.62▲ 2.66% USD/VES853.52▼ 0.13% USD/PAB1.00— 0.00% USD/BZD2.00— 0.00% USD/JMD 157.28 — 0.00% USD/TTD6.77▲ 2.72% EUR/BRL5.91▲ 0.63% BRENT 88.88 ▼ 0.03% WTI 83.11 ▼ 0.11% IRON ORE 161.91 — — COPPER 6.61 ▲ 0.03% GOLD 4,461 ▲ 1.78% SILVER 65.59 ▲ 1.26% SOY 1,184 ▲ 3.20% CORN 480.50 ▲ 10.02% WHEAT 655.00 ▲ 3.93% COFFEE 317.25 ▼ 5.51% SUGAR 16.43 ▼ 1.79% ORANGE JUICE 138.55 ▼ 0.47% COTTON 85.03 ▲ 2.33% COCOA 5,719 ▲ 3.18% BEEF 223.60 ▼ 3.93% CATTLE 339.10 ▼ 3.16% LITHIUM 75.20 ▲ 1.47% PETR4 41.64 ▼ 0.05% VALE3 72.97 ▲ 0.83% ITUB4 38.60 ▼ 1.03% BBDC4 16.85 ▲ 0.36% ABEV3 14.89 ▼ 0.80% BBAS3 19.37 ▲ 0.47% B3SA3 14.26 ▼ 0.21% WEGE3 47.59 ▲ 0.49% PRIO3 59.14 ▼ 0.19% SUZB3 41.33 ▲ 2.35% RENT3 34.68 ▼ 0.09% AZZA3 15.89 ▼ 2.63% CSAN3 3.22 ▼ 1.83% RAIZ4 0.25 — 0.00% PCAR3 2.75 ▼ 0.36% GMAT3 3.65 ▼ 1.08% PSSA3 48.13 ▼ 0.54% CVCB3 1.33 ▼ 2.92% POSI3 3.36 ▲ 2.44% SLCE3 13.34 ▲ 0.30% NATU3 8.14 ▼ 0.73% IBOV 183,476.86 ▼ 0.27% IPSA 11,256.80 ▼ 0.38% IPC MEX 64,992.23 ▲ 1.13% MERVAL 2,893,751 ▼ 1.57% COLCAP 2,584.72 ▼ 0.95% BVL PERÚ 59,934.37 ▲ 1.27% USD/BRL 5.16 ▲ 0.01% USD/MXN 17.06 ▼ 0.24% USD/CLP 913.98 ▲ 0.04% USD/COP 3,140 ▲ 0.03% USD/PEN 3.36 ▼ 0.66% USD/ARS 1,493 ▲ 0.10% USD/UYU 40.27 ▲ 1.24% USD/PYG 5,939 ▲ 1.68% USD/BOB 11.64 ▼ 0.76% USD/DOP 58.34 ▲ 1.25% USD/CRC 445.92 ▲ 0.89% USD/GTQ 7.62 ▲ 2.21% USD/HNL 26.79 ▲ 1.57% USD/NIO 36.62 ▲ 0.69% USD/VES 762.44 ▼ 0.13% USD/PAB 1.00 — 0.00% USD/BZD 2.00 — 0.00% USD/JMD 157.28 — 0.00% USD/TTD 6.70 ▲ 0.61% EUR/BRL 5.95 ▲ 1.01% BRENT 88.88 ▼ 0.03% WTI 83.11 ▼ 0.11% IRON ORE 161.91 — — COPPER 6.61 ▲ 0.03% GOLD 4,461 ▲ 1.78% SILVER 65.59 ▲ 1.26% SOY 1,184 ▲ 3.20% CORN 480.50 ▲ 10.02% WHEAT 655.00 ▲ 3.93% COFFEE 317.25 ▼ 5.51% SUGAR 16.43 ▼ 1.79% ORANGE JUICE 138.55 ▼ 0.47% COTTON 85.03 ▲ 2.33% COCOA 5,719 ▲ 3.18% BEEF 223.60 ▼ 3.93% CATTLE 339.10 ▼ 3.16% LITHIUM 75.20 ▲ 1.47% PETR4 41.64 ▼ 0.05% VALE3 72.97 ▲ 0.83% ITUB4 38.60 ▼ 1.03% BBDC4 16.85 ▲ 0.36% ABEV3 14.89 ▼ 0.80% BBAS3 19.37 ▲ 0.47% B3SA3 14.26 ▼ 0.21% WEGE3 47.59 ▲ 0.49% PRIO3 59.14 ▼ 0.19% SUZB3 41.33 ▲ 2.35% RENT3 34.68 ▼ 0.09% AZZA3 15.89 ▼ 2.63% CSAN3 3.22 ▼ 1.83% RAIZ4 0.25 — 0.00% PCAR3 2.75 ▼ 0.36% GMAT3 3.65 ▼ 1.08% PSSA3 48.13 ▼ 0.54% CVCB3 1.33 ▼ 2.92% POSI3 3.36 ▲ 2.44% SLCE3 13.34 ▲ 0.30% NATU3 8.14 ▼ 0.73%
since 2009
Sunday, September 27, 2026

China’s Manufacturing Resilience Surprises Markets

By · December 2, 2024 · 2 min read

The LatAm Brief

One email, every weekday morning. What moved in Latin American markets, politics and expat life.

Yesterday’s subject line: “The US Army is quietly planning for Cuba”

Free. We send a confirmation link first — nothing arrives until you click it. Unsubscribe with one click in any edition. If you stop opening us for 30 days we stop sending by ourselves, as we assume the interest is no longer there. See our privacy policy. We never share your email.

China’s manufacturing sector showed unexpected strength in November, defying analysts’ predictions. The Caixin/S&P Global manufacturing PMI rose to 51.5 from 50.3 in October, surpassing the forecast of 50.5.

This uptick indicates a significant expansion in factory activity. The surge stems from recent economic stimuli implemented since late September. New orders, both domestic and international, grew at the fastest pace in over three years.

Production levels increased solidly, driven by this influx of orders. Intermediate and investment goods sectors led the growth, while consumer goods saw a slight decline.

Business confidence among manufacturers reached an eight-month high, reflecting optimism about future economic conditions and government policies. This aligns with the official PMI data, which also reported modest expansion.

However, challenges persist in China‘s economy. Real estate investment declined by 10.3% from January to October, and industrial profits fell by 10% in October. These figures highlight ongoing structural issues.
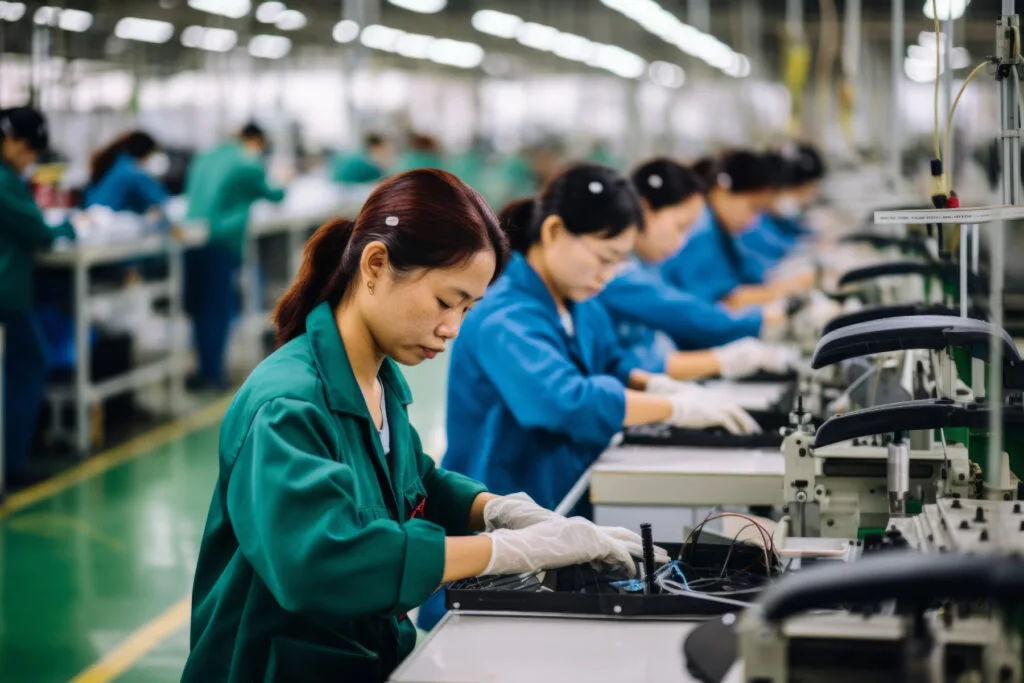
China's Manufacturing Resilience Surprises Markets
China’s Manufacturing Resilience Surprises Markets.
One-stop reference
Company Intelligence
Every listed company in Latin America — financials, ownership and structure for 1,450+ companies across 26 exchanges, in one place.
Browse the directory →
RT
Ask Rio Times
Latin American markets, currencies and companies.
Open the full Ask Rio Times →

The manufacturing sector‘s growth occurs amid global economic uncertainties, including potential trade tensions with the United States.

Despite these challenges, China remains a dominant force in global manufacturing, contributing about 30% of global manufacturing added value in 2023.

China’s Economic Shift

China’s economic strategy now focuses on shifting capital from real estate to technology-intensive manufacturing. This approach aims to offset challenges like a declining population through productivity gains in high-tech industries.

The country is pursuing self-sufficiency in core technologies to withstand external pressures. Recent economic measures aim to stabilize growth at around 5%, including efforts to reverse the decline in housing sales and provide relief to local governments.

China is transitioning to a “new normal” economy, emphasizing consumption-driven growth and environmentally conscious expansion. The country’s innovation capabilities have significantly improved, particularly in the ICT sector.

However, the manufacturing sector now faces the challenge of transitioning from quantity to quality, as outlined in the “Made in China 2025” initiative.

As China navigates these economic shifts, the manufacturing sector’s performance remains a key indicator of the country’s overall economic health and future trajectory.

This article was produced by The Rio Times’ automated newsroom system. How we use AI · Report an error

Read More from The Rio Times

The Rio Times · Power Map
See who really holds power in Latin America
Click to open the Power Map →

Rotate for Best Experience

This report is optimized for landscape viewing. Rotate your phone for the full experience.