IBOV 185,147.15 ▼ 0.02% IPSA 11,315.26 ▼ 1.14% IPC MEX 64,639.55 ▼ 0.35% MERVAL 3,034,599 ▼ 0.48% COLCAP 2,565.50 ▲ 0.82% BVL PERÚ 59,789.81 ▼ 0.28% USD/BRL5.13▼ 0.03% USD/MXN16.94▲ 0.39% USD/CLP933.48▼ 0.12% USD/COP3,121▼ 0.28% USD/PEN3.35▼ 0.03% USD/ARS1,511▲ 0.15% USD/UYU40.24— 0.00% USD/PYG5,947— 0.00% USD/BOB12.40— 0.00% USD/DOP59.00— 0.00% USD/CRC448.67— 0.00% USD/GTQ7.63— 0.00% USD/HNL26.84— 0.00% USD/NIO36.62— 0.00% USD/VES812.65▲ 0.78% USD/PAB1.00— 0.00% USD/BZD2.00— 0.00% USD/JMD 157.28 — 0.00% USD/TTD6.71— 0.00% EUR/BRL5.96▲ 0.20% BRENT 88.88 ▼ 0.03% WTI 83.11 ▼ 0.11% IRON ORE 161.91 — — COPPER 6.61 ▲ 0.03% GOLD 4,461 ▲ 1.78% SILVER 65.59 ▲ 1.26% SOY 1,184 ▲ 3.20% CORN 480.50 ▲ 10.02% WHEAT 655.00 ▲ 3.93% COFFEE 317.25 ▼ 5.51% SUGAR 16.43 ▼ 1.79% ORANGE JUICE 138.55 ▼ 0.47% COTTON 85.03 ▲ 2.33% COCOA 5,719 ▲ 3.18% BEEF 223.60 ▼ 3.93% CATTLE 339.10 ▼ 3.16% LITHIUM 75.20 ▲ 1.47% PETR4 41.64 ▼ 0.05% VALE3 72.97 ▲ 0.83% ITUB4 38.60 ▼ 1.03% BBDC4 16.85 ▲ 0.36% ABEV3 14.89 ▼ 0.80% BBAS3 19.37 ▲ 0.47% B3SA3 14.26 ▼ 0.21% WEGE3 47.59 ▲ 0.49% PRIO3 59.14 ▼ 0.19% SUZB3 41.33 ▲ 2.35% RENT3 34.68 ▼ 0.09% AZZA3 15.89 ▼ 2.63% CSAN3 3.22 ▼ 1.83% RAIZ4 0.25 — 0.00% PCAR3 2.75 ▼ 0.36% GMAT3 3.65 ▼ 1.08% PSSA3 48.13 ▼ 0.54% CVCB3 1.33 ▼ 2.92% POSI3 3.36 ▲ 2.44% SLCE3 13.34 ▲ 0.30% NATU3 8.14 ▼ 0.73% IBOV 185,147.15 ▼ 0.02% IPSA 11,315.26 ▼ 1.14% IPC MEX 64,639.55 ▼ 0.35% MERVAL 3,034,599 ▼ 0.48% COLCAP 2,565.50 ▲ 0.82% BVL PERÚ 59,789.81 ▼ 0.28% USD/BRL 5.16 ▲ 0.01% USD/MXN 17.06 ▼ 0.24% USD/CLP 913.98 ▲ 0.04% USD/COP 3,140 ▲ 0.03% USD/PEN 3.36 ▼ 0.66% USD/ARS 1,493 ▲ 0.10% USD/UYU 40.27 ▲ 1.24% USD/PYG 5,939 ▲ 1.68% USD/BOB 11.64 ▼ 0.76% USD/DOP 58.34 ▲ 1.25% USD/CRC 445.92 ▲ 0.89% USD/GTQ 7.62 ▲ 2.21% USD/HNL 26.79 ▲ 1.57% USD/NIO 36.62 ▲ 0.69% USD/VES 762.44 ▼ 0.13% USD/PAB 1.00 — 0.00% USD/BZD 2.00 — 0.00% USD/JMD 157.28 — 0.00% USD/TTD 6.70 ▲ 0.61% EUR/BRL 5.95 ▲ 1.01% BRENT 88.88 ▼ 0.03% WTI 83.11 ▼ 0.11% IRON ORE 161.91 — — COPPER 6.61 ▲ 0.03% GOLD 4,461 ▲ 1.78% SILVER 65.59 ▲ 1.26% SOY 1,184 ▲ 3.20% CORN 480.50 ▲ 10.02% WHEAT 655.00 ▲ 3.93% COFFEE 317.25 ▼ 5.51% SUGAR 16.43 ▼ 1.79% ORANGE JUICE 138.55 ▼ 0.47% COTTON 85.03 ▲ 2.33% COCOA 5,719 ▲ 3.18% BEEF 223.60 ▼ 3.93% CATTLE 339.10 ▼ 3.16% LITHIUM 75.20 ▲ 1.47% PETR4 41.64 ▼ 0.05% VALE3 72.97 ▲ 0.83% ITUB4 38.60 ▼ 1.03% BBDC4 16.85 ▲ 0.36% ABEV3 14.89 ▼ 0.80% BBAS3 19.37 ▲ 0.47% B3SA3 14.26 ▼ 0.21% WEGE3 47.59 ▲ 0.49% PRIO3 59.14 ▼ 0.19% SUZB3 41.33 ▲ 2.35% RENT3 34.68 ▼ 0.09% AZZA3 15.89 ▼ 2.63% CSAN3 3.22 ▼ 1.83% RAIZ4 0.25 — 0.00% PCAR3 2.75 ▼ 0.36% GMAT3 3.65 ▼ 1.08% PSSA3 48.13 ▼ 0.54% CVCB3 1.33 ▼ 2.92% POSI3 3.36 ▲ 2.44% SLCE3 13.34 ▲ 0.30% NATU3 8.14 ▼ 0.73%
since 2009
Tuesday, September 8, 2026

Brazil’s 24-Year Struggle with Transportation Infrastructure Investment

By · July 11, 2024 · 2 min read

Daily Brief

The morning intel from across Latin America. Free.

By subscribing you agree to our privacy policy. We never share your email.

Investment in Brazil’s transportation infrastructure has dropped 16.42% as a share of nominal GDP from 2001 to 2023.

A Logística Brasil study reveals that for 24 years, investments have lagged below necessary levels. Brazil, across five presidencies, failed to allocate even 1% of its GDP to this crucial sector.

In 2023, the Brazilian Association of Infrastructure and Basic Industries (Abdib) indicated that Brazil needs to invest 2.26% of GDP to cover public transport asset depreciation.

Persistent underfunding over a quarter century has deteriorated the country’s infrastructure quality.

Transportation infrastructure investments are crucial for reducing logistical costs and the “Custo Brasil.” From 2001 to 2023, investment fell by 16.42% relative to nominal GDP.

Economist Riley Rodrigues de Oliveira emphasizes that economic performance directly links to transportation infrastructure quality.
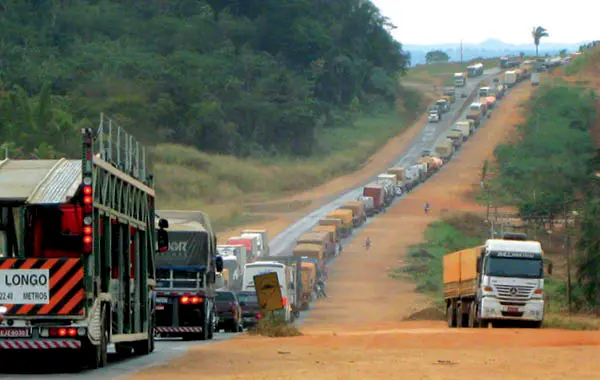
Brazil’s 24-Year Struggle with Transportation Infrastructure Investment.
One-stop reference
Company Intelligence
Every listed company in Latin America — financials, ownership and structure for 1,450+ companies across 26 exchanges, in one place.
Browse the directory →
RT
Ask Rio Times
This story and the bigger picture.
Open the full Ask Rio Times →

Improved infrastructure lowers costs for raw materials and product distribution, enhancing competitiveness by reducing production and transport expenses.

President Luiz Inácio Lula da Silva’s second term saw the highest GDP proportion invested in transportation infrastructure.

However, subsequent administrations failed to maintain these investment levels, leading to financial constraints by the end of the Workers’ Party governments.

During former President Jair Bolsonaro’s administration, infrastructure investments rose but remained insufficient.

The COVID-19 pandemic further strained resources, keeping investments just above 0.5% of GDP.

Since 2013, factors including high fiscal deficits, corruption scandals, market volatility, and investor insecurity decreased infrastructure investment to 0.47% of GDP from 2014 to 2023.

Brazil’s 24-Year Struggle with Transportation Infrastructure Investment

Over the past 24 years, public investments averaged 0.30% of nominal GDP. The peak was in 2010, with the government investing 0.55% of GDP in transportation.

Private sector investments averaged 0.29% of GDP, peaking at 0.43% in 2005. From 2012 to 2021, the private sector led investments, averaging 0.26% of GDP.

Recently, the federal government resumed leading, investing 0.33% of GDP compared to the private sector’s 0.24%.

The Logística Brasil study suggests expanding concessions and public-private partnerships, integrated with regulatory bodies to ensure timely project completion.

Oliveira recommends shifting focus from large projects to smaller, quickly executable ventures benefiting the entire economic chain.

This article was produced by The Rio Times’ automated newsroom system. How we use AI · Report an error

Read More from The Rio Times

The Rio Times · Power Map
See who really holds power in Latin America
Click to open the Power Map

Rotate for Best Experience

This report is optimized for landscape viewing. Rotate your phone for the full experience.