IBOV 183,827.59 ▲ 0.46% IPSA 11,055.91 ▼ 0.73% IPC MEX 65,110.57 ▲ 0.26% MERVAL 2,782,561 ▼ 0.59% COLCAP 2,558.92 ▼ 0.79% BVL PERÚ 60,220.45 ▲ 0.32% USD/BRL5.20▲ 0.01% USD/MXN18.03▼ 0.10% USD/CLP972.08▲ 0.38% USD/COP3,325▼ 1.30% USD/PEN3.44— 0.00% USD/ARS1,524▼ 0.05% USD/UYU40.27▲ 3.67% USD/PYG5,843▲ 2.30% USD/BOB11.96▲ 0.45% USD/DOP59.27▲ 2.75% USD/CRC452.68▲ 2.68% USD/GTQ7.64▲ 3.13% USD/HNL26.87▲ 3.23% USD/NIO36.62▲ 0.34% USD/VES856.92▲ 0.01% USD/PAB1.00— 0.00% USD/BZD2.00— 0.00% USD/JMD 157.28 — 0.00% USD/TTD6.70▲ 1.64% EUR/BRL5.91▼ 0.48% BRENT 88.88 ▼ 0.03% WTI 83.11 ▼ 0.11% IRON ORE 161.91 — — COPPER 6.61 ▲ 0.03% GOLD 4,461 ▲ 1.78% SILVER 65.59 ▲ 1.26% SOY 1,184 ▲ 3.20% CORN 480.50 ▲ 10.02% WHEAT 655.00 ▲ 3.93% COFFEE 317.25 ▼ 5.51% SUGAR 16.43 ▼ 1.79% ORANGE JUICE 138.55 ▼ 0.47% COTTON 85.03 ▲ 2.33% COCOA 5,719 ▲ 3.18% BEEF 223.60 ▼ 3.93% CATTLE 339.10 ▼ 3.16% LITHIUM 75.20 ▲ 1.47% PETR4 41.64 ▼ 0.05% VALE3 72.97 ▲ 0.83% ITUB4 38.60 ▼ 1.03% BBDC4 16.85 ▲ 0.36% ABEV3 14.89 ▼ 0.80% BBAS3 19.37 ▲ 0.47% B3SA3 14.26 ▼ 0.21% WEGE3 47.59 ▲ 0.49% PRIO3 59.14 ▼ 0.19% SUZB3 41.33 ▲ 2.35% RENT3 34.68 ▼ 0.09% AZZA3 15.89 ▼ 2.63% CSAN3 3.22 ▼ 1.83% RAIZ4 0.25 — 0.00% PCAR3 2.75 ▼ 0.36% GMAT3 3.65 ▼ 1.08% PSSA3 48.13 ▼ 0.54% CVCB3 1.33 ▼ 2.92% POSI3 3.36 ▲ 2.44% SLCE3 13.34 ▲ 0.30% NATU3 8.14 ▼ 0.73% IBOV 183,827.59 ▲ 0.46% IPSA 11,055.91 ▼ 0.73% IPC MEX 65,110.57 ▲ 0.26% MERVAL 2,782,561 ▼ 0.59% COLCAP 2,558.92 ▼ 0.79% BVL PERÚ 60,220.45 ▲ 0.32% USD/BRL 5.16 ▲ 0.01% USD/MXN 17.06 ▼ 0.24% USD/CLP 913.98 ▲ 0.04% USD/COP 3,140 ▲ 0.03% USD/PEN 3.36 ▼ 0.66% USD/ARS 1,493 ▲ 0.10% USD/UYU 40.27 ▲ 1.24% USD/PYG 5,939 ▲ 1.68% USD/BOB 11.64 ▼ 0.76% USD/DOP 58.34 ▲ 1.25% USD/CRC 445.92 ▲ 0.89% USD/GTQ 7.62 ▲ 2.21% USD/HNL 26.79 ▲ 1.57% USD/NIO 36.62 ▲ 0.69% USD/VES 762.44 ▼ 0.13% USD/PAB 1.00 — 0.00% USD/BZD 2.00 — 0.00% USD/JMD 157.28 — 0.00% USD/TTD 6.70 ▲ 0.61% EUR/BRL 5.95 ▲ 1.01% BRENT 88.88 ▼ 0.03% WTI 83.11 ▼ 0.11% IRON ORE 161.91 — — COPPER 6.61 ▲ 0.03% GOLD 4,461 ▲ 1.78% SILVER 65.59 ▲ 1.26% SOY 1,184 ▲ 3.20% CORN 480.50 ▲ 10.02% WHEAT 655.00 ▲ 3.93% COFFEE 317.25 ▼ 5.51% SUGAR 16.43 ▼ 1.79% ORANGE JUICE 138.55 ▼ 0.47% COTTON 85.03 ▲ 2.33% COCOA 5,719 ▲ 3.18% BEEF 223.60 ▼ 3.93% CATTLE 339.10 ▼ 3.16% LITHIUM 75.20 ▲ 1.47% PETR4 41.64 ▼ 0.05% VALE3 72.97 ▲ 0.83% ITUB4 38.60 ▼ 1.03% BBDC4 16.85 ▲ 0.36% ABEV3 14.89 ▼ 0.80% BBAS3 19.37 ▲ 0.47% B3SA3 14.26 ▼ 0.21% WEGE3 47.59 ▲ 0.49% PRIO3 59.14 ▼ 0.19% SUZB3 41.33 ▲ 2.35% RENT3 34.68 ▼ 0.09% AZZA3 15.89 ▼ 2.63% CSAN3 3.22 ▼ 1.83% RAIZ4 0.25 — 0.00% PCAR3 2.75 ▼ 0.36% GMAT3 3.65 ▼ 1.08% PSSA3 48.13 ▼ 0.54% CVCB3 1.33 ▼ 2.92% POSI3 3.36 ▲ 2.44% SLCE3 13.34 ▲ 0.30% NATU3 8.14 ▼ 0.73%
since 2009
Wednesday, September 30, 2026

Brazil Business - Brazil

Prices in Brazil surged by 5% over the past year

By · September 26, 2023 · 2 min read

The LatAm Brief

One email, every weekday morning. What moved in Latin American markets, politics and expat life.

Yesterday’s subject line: “Argentina gives Britain two weeks over Falklands oil”

Free. We send a confirmation link first — nothing arrives until you click it. Unsubscribe with one click in any edition. If you stop opening us for 30 days we stop sending by ourselves, as we assume the interest is no longer there. See our privacy policy. We never share your email.

The Brazilian Institute of Geography and Statistics (IBGE) recently reported varying inflation rates.

The 12-month Broad Consumer Price Index-15 (IPCA-15) revealed a low of 3.61% in Rio de Janeiro and a high of 6.16% in the Federal District.

On average, the nation saw a 5% increase in prices.

Free daily brief — no card needed
Get every Brazil story in one morning email
We build you a personalized brief around the topics you follow — free for 7 days. Love it? Your first month after that is US$1.

IBGE tracks inflation in nine city regions and two separate cities, Brasília and Goiânia. After Rio, the smallest jumps were in Salvador at 4.52% and Goiânia at 4.6%.

Conversely, the highest inflation rates followed the Federal District: Belém showed 5.67%, Recife 5.56%, and Porto Alegre 5.61%.

Lastly, other areas included Curitiba with 4.89%, Belo Horizonte at 5.07%, São Paulo with 5.10%, and Fortaleza at 5.24%.
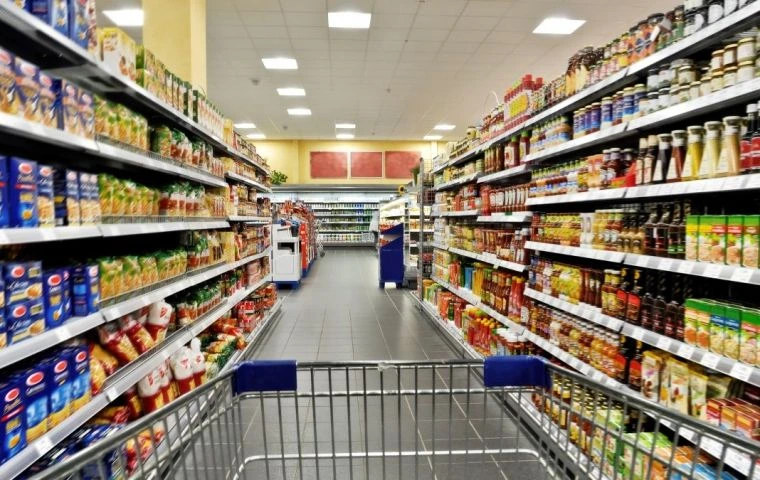
Brazil saw a 5% increase in prices.
Prices in Brazil surged by 5% over the past year
One-stop reference
Company Intelligence
Every listed company in Latin America — financials, ownership and structure for 1,450+ companies across 26 exchanges, in one place.
Browse the directory →
RT
Ask Rio Times
Latin American markets, currencies and companies.
Open the full Ask Rio Times →

To understand these figures, it’s vital to note that inflation impacts regions differently. For example, local policies and resources can affect price changes.

This could explain why Rio sees the lowest rate, while the Federal District tops the list.

Historically, Brazil has grappled with inflation. In the ’90s, the country faced hyperinflation, affecting economic stability.

Since then, reforms like the Real Plan have sought to bring balance. They have been mostly successful, but challenges remain.

Moreover, inflation often hits lower-income families the hardest. Their budgets are less flexible, making them vulnerable to even small price hikes.

Social programs aim to mitigate this, but they’re not always enough.

Background

Furthermore, fluctuating inflation can influence the central bank’s decisions. It often adjusts interest rates to either curb or stimulate economic activity.

So, the 5% national average could prompt action.

Additionally, food, energy, and healthcare sectors often show the most volatility. These are essential services, affecting daily life for millions.

Therefore, governing bodies closely monitor such sectors.

Brazil’s approach to managing inflation has been a mix of monetary policy and fiscal responsibility. Economic tools like interest rate adjustments often come into play.


This article was produced by The Rio Times’ automated newsroom system. How we use AI · Report an error

Read More from The Rio Times

The Rio Times · Power Map
See who really holds power in Latin America
Click to open the Power Map →

Rotate for Best Experience

This report is optimized for landscape viewing. Rotate your phone for the full experience.