IBOV 171,031.73 ▲ 1.85% IPSA 11,338.38 ▲ 0.89% IPC MEX 65,729.18 ▲ 2.14% MERVAL 2,913,184 ▲ 1.30% COLCAP 2,459.23 ▲ 0.61% BVL PERÚ 58,698.13 ▲ 2.60% USD/BRL5.14▼ 0.05% USD/MXN16.93▲ 0.10% USD/CLP914.28— 0.00% USD/COP3,044▲ 0.21% USD/PEN3.36▲ 0.04% USD/ARS1,499▼ 0.03% USD/UYU40.20▲ 1.52% USD/PYG5,996▲ 1.39% USD/BOB11.43▲ 0.51% USD/DOP58.82▲ 0.19% USD/CRC450.05▲ 1.95% USD/GTQ7.62▲ 2.13% USD/HNL26.81▲ 1.55% USD/NIO36.62— 0.00% USD/VES782.70▼ 0.13% USD/PAB1.00— 0.00% USD/BZD2.00— 0.00% USD/JMD 157.28 — 0.00% USD/TTD6.71▲ 0.82% EUR/BRL6.00▼ 1.04% BRENT 88.88 ▼ 0.03% WTI 83.11 ▼ 0.11% IRON ORE 161.91 — — COPPER 6.61 ▲ 0.03% GOLD 4,461 ▲ 1.78% SILVER 65.59 ▲ 1.26% SOY 1,184 ▲ 3.20% CORN 480.50 ▲ 10.02% WHEAT 655.00 ▲ 3.93% COFFEE 317.25 ▼ 5.51% SUGAR 16.43 ▼ 1.79% ORANGE JUICE 138.55 ▼ 0.47% COTTON 85.03 ▲ 2.33% COCOA 5,719 ▲ 3.18% BEEF 223.60 ▼ 3.93% CATTLE 339.10 ▼ 3.16% LITHIUM 75.20 ▲ 1.47% PETR4 41.64 ▼ 0.05% VALE3 72.97 ▲ 0.83% ITUB4 38.60 ▼ 1.03% BBDC4 16.85 ▲ 0.36% ABEV3 14.89 ▼ 0.80% BBAS3 19.37 ▲ 0.47% B3SA3 14.26 ▼ 0.21% WEGE3 47.59 ▲ 0.49% PRIO3 59.14 ▼ 0.19% SUZB3 41.33 ▲ 2.35% RENT3 34.68 ▼ 0.09% AZZA3 15.89 ▼ 2.63% CSAN3 3.22 ▼ 1.83% RAIZ4 0.25 — 0.00% PCAR3 2.75 ▼ 0.36% GMAT3 3.65 ▼ 1.08% PSSA3 48.13 ▼ 0.54% CVCB3 1.33 ▼ 2.92% POSI3 3.36 ▲ 2.44% SLCE3 13.34 ▲ 0.30% NATU3 8.14 ▼ 0.73% IBOV 171,031.73 ▲ 1.85% IPSA 11,338.38 ▲ 0.89% IPC MEX 65,729.18 ▲ 2.14% MERVAL 2,913,184 ▲ 1.30% COLCAP 2,459.23 ▲ 0.61% BVL PERÚ 58,698.13 ▲ 2.60% USD/BRL 5.16 ▲ 0.01% USD/MXN 17.06 ▼ 0.24% USD/CLP 913.98 ▲ 0.04% USD/COP 3,140 ▲ 0.03% USD/PEN 3.36 ▼ 0.66% USD/ARS 1,493 ▲ 0.10% USD/UYU 40.27 ▲ 1.24% USD/PYG 5,939 ▲ 1.68% USD/BOB 11.64 ▼ 0.76% USD/DOP 58.34 ▲ 1.25% USD/CRC 445.92 ▲ 0.89% USD/GTQ 7.62 ▲ 2.21% USD/HNL 26.79 ▲ 1.57% USD/NIO 36.62 ▲ 0.69% USD/VES 762.44 ▼ 0.13% USD/PAB 1.00 — 0.00% USD/BZD 2.00 — 0.00% USD/JMD 157.28 — 0.00% USD/TTD 6.70 ▲ 0.61% EUR/BRL 5.95 ▲ 1.01% BRENT 88.88 ▼ 0.03% WTI 83.11 ▼ 0.11% IRON ORE 161.91 — — COPPER 6.61 ▲ 0.03% GOLD 4,461 ▲ 1.78% SILVER 65.59 ▲ 1.26% SOY 1,184 ▲ 3.20% CORN 480.50 ▲ 10.02% WHEAT 655.00 ▲ 3.93% COFFEE 317.25 ▼ 5.51% SUGAR 16.43 ▼ 1.79% ORANGE JUICE 138.55 ▼ 0.47% COTTON 85.03 ▲ 2.33% COCOA 5,719 ▲ 3.18% BEEF 223.60 ▼ 3.93% CATTLE 339.10 ▼ 3.16% LITHIUM 75.20 ▲ 1.47% PETR4 41.64 ▼ 0.05% VALE3 72.97 ▲ 0.83% ITUB4 38.60 ▼ 1.03% BBDC4 16.85 ▲ 0.36% ABEV3 14.89 ▼ 0.80% BBAS3 19.37 ▲ 0.47% B3SA3 14.26 ▼ 0.21% WEGE3 47.59 ▲ 0.49% PRIO3 59.14 ▼ 0.19% SUZB3 41.33 ▲ 2.35% RENT3 34.68 ▼ 0.09% AZZA3 15.89 ▼ 2.63% CSAN3 3.22 ▼ 1.83% RAIZ4 0.25 — 0.00% PCAR3 2.75 ▼ 0.36% GMAT3 3.65 ▼ 1.08% PSSA3 48.13 ▼ 0.54% CVCB3 1.33 ▼ 2.92% POSI3 3.36 ▲ 2.44% SLCE3 13.34 ▲ 0.30% NATU3 8.14 ▼ 0.73%
since 2009
Monday, August 24, 2026

Brazil Business - Brazil

Auren Energia’s Q3 Profit Surge: R$270.8M Gain Reverses Previous Loss

By · October 31, 2024 · 2 min read

Daily Brief

The morning intel from across Latin America. Free.

By subscribing you agree to our privacy policy. We never share your email.

Auren Energia, a prominent player in Brazil’s energy sector, has defied expectations with its third-quarter results for 2024.

The company reported a net profit of R$270.8 million ($48.4 million), marking a significant reversal from the R$838.1 million loss in the same period last year.

This impressive turnaround stems from several factors. Auren’s revenue reached R$2.046 billion ($365.4 million), a 25.8% increase year-over-year.

The company benefited from a 37.3% rise in energy trading volume. New solar projects, Sol do Piauí and Sol de Jaíba, also contributed to the improved performance.

Auren’s adjusted EBITDA grew by 6.9% to R$484.3 million ($86.5 million). This growth occurred despite challenges in the hydroelectric segment, where average prices declined due to the expiration of long-term contracts.
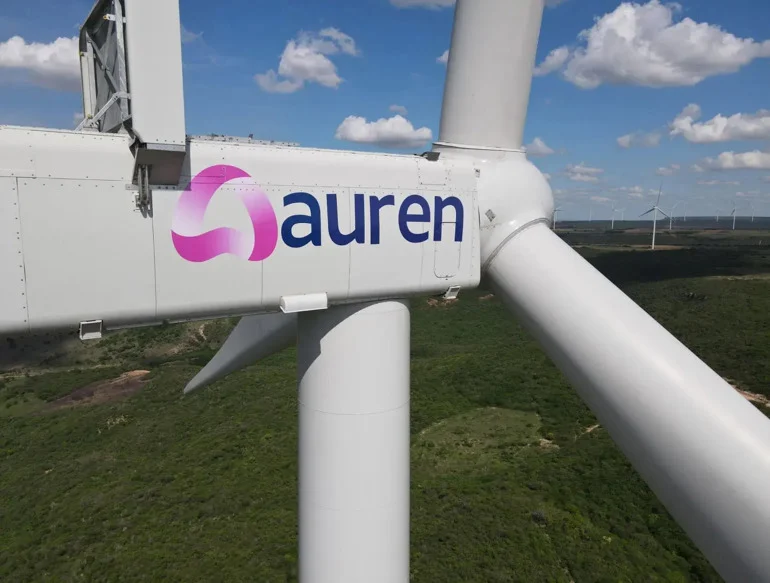
Auren Energia's Q3 Profit Surge: R$270.8M Gain Reverses Previous Loss
Auren Energia’s Q3 Profit Surge: R$270.8M Gain Reverses Previous Loss. (Photo Internet reproduction)
One-stop reference
Company Intelligence
Every listed company in Latin America — financials, ownership and structure for 1,450+ companies across 26 exchanges, in one place.
Browse the directory →
RT
Ask Rio Times
Latin American markets, currencies and companies.
Open the full Ask Rio Times →

The company’s net debt stood at R$2.898 billion ($517.5 million) at the end of September, a 156.2% increase from the previous year.

Auren’s Financial Strategy and Growth Outlook

Auren’s leverage ratio, measured by net debt to adjusted EBITDA, rose to 1.60 times from 0.62 times a year earlier. Auren’s CEO, Fábio Zanfelice, expressed satisfaction with the results.

He highlighted the strong performance in energy trading and the company’s ability to capitalize on the recent drought conditions in Brazil.

Looking ahead, Auren faces both opportunities and challenges. The recent acquisition of AES Brasil will significantly expand its operational capacity.

Post-acquisition, Auren will become Brazil’s third-largest energy generating company, with 39 assets totaling 8.8 GW of installed capacity.

However, this growth comes at a cost. The company’s leverage is expected to increase substantially following the AES Brasil incorporation.

Auren made two issuances in October 2024 to finance the acquisition, which will likely push leverage higher in the coming quarters. As of Q3 2024, Auren had R$5.2 billion ($928.6 million) in cash.

Recent market fundraising has boosted this figure to approximately R$13 billion ($2.32 billion). If AES Brasil shareholders opt for cash payments, Auren may need to disburse up to R$7 billion ($1.25 billion).

Despite these challenges, Auren‘s management remains optimistic. The company estimates corporate synergies of R$1.2 billion ($214.3 million) from the AES Brasil acquisition, with additional operational and financial benefits expected in the future.

As Auren navigates these changes, investors and industry observers will closely monitor its ability to integrate AES Brasil’s assets, manage its increased debt load, and maintain its competitive position in Brazil’s evolving energy market.

This article was produced by The Rio Times’ automated newsroom system. How we use AI · Report an error

LatAm Markets: Live Signals → — real-time movers, turnover leaders and FX across Latin America.

Read More from The Rio Times

The Rio Times · Power Map
See who really holds power in Latin America
Click to open the Power Map

Rotate for Best Experience

This report is optimized for landscape viewing. Rotate your phone for the full experience.