
Energy: Venezuela
Published Monday, 9 November, 6:36 a.m. ET (7:36 a.m. Caracas) · Source: US Energy Information Administration (EIA)
Key Facts
—July imports. US imports of Venezuelan crude averaged 701,000 barrels a day in July 2026, the most since May 2017.
—Since then. Imports eased to 655,000 barrels a day in August; they started the year near 200,000.
—Why. Strong refinery demand and eased US restrictions on Venezuelan oil, the EIA says; Venezuela has sent none to China this year.
—Next. The EIA’s next weekly import figures show whether late-October cargoes arrived.
This story is part of our coverage of the venezuela us tensions. Dates, times and how to follow it are in our guide.
In plain English
The United States buys more oil from Venezuela than at any time in nine years. The US government’s own energy statisticians say the cause is hungry refineries on the Gulf of Mexico coast and fewer US restrictions on Venezuelan oil.
Venezuela is quietly becoming one of America’s main oil suppliers again, and the numbers now say so. The US Energy Information Administration (EIA), the federal government’s energy statistics agency, reported on Friday, 6 November that US crude imports from Venezuela averaged 701,000 barrels a day in July, the most since May 2017.
That is a sharp turn in a Venezuela US tensions story that is usually told in sanctions and threats. Imports slipped to 655,000 barrels a day in August, but they began 2026 at only about 200,000.
Why Gulf Coast Refiners Want It
The EIA gives two reasons. US refineries have strong demand for crude because global refining margins, the profit on turning oil into fuel, are high, and Washington has eased its restrictions on buying Venezuelan oil.
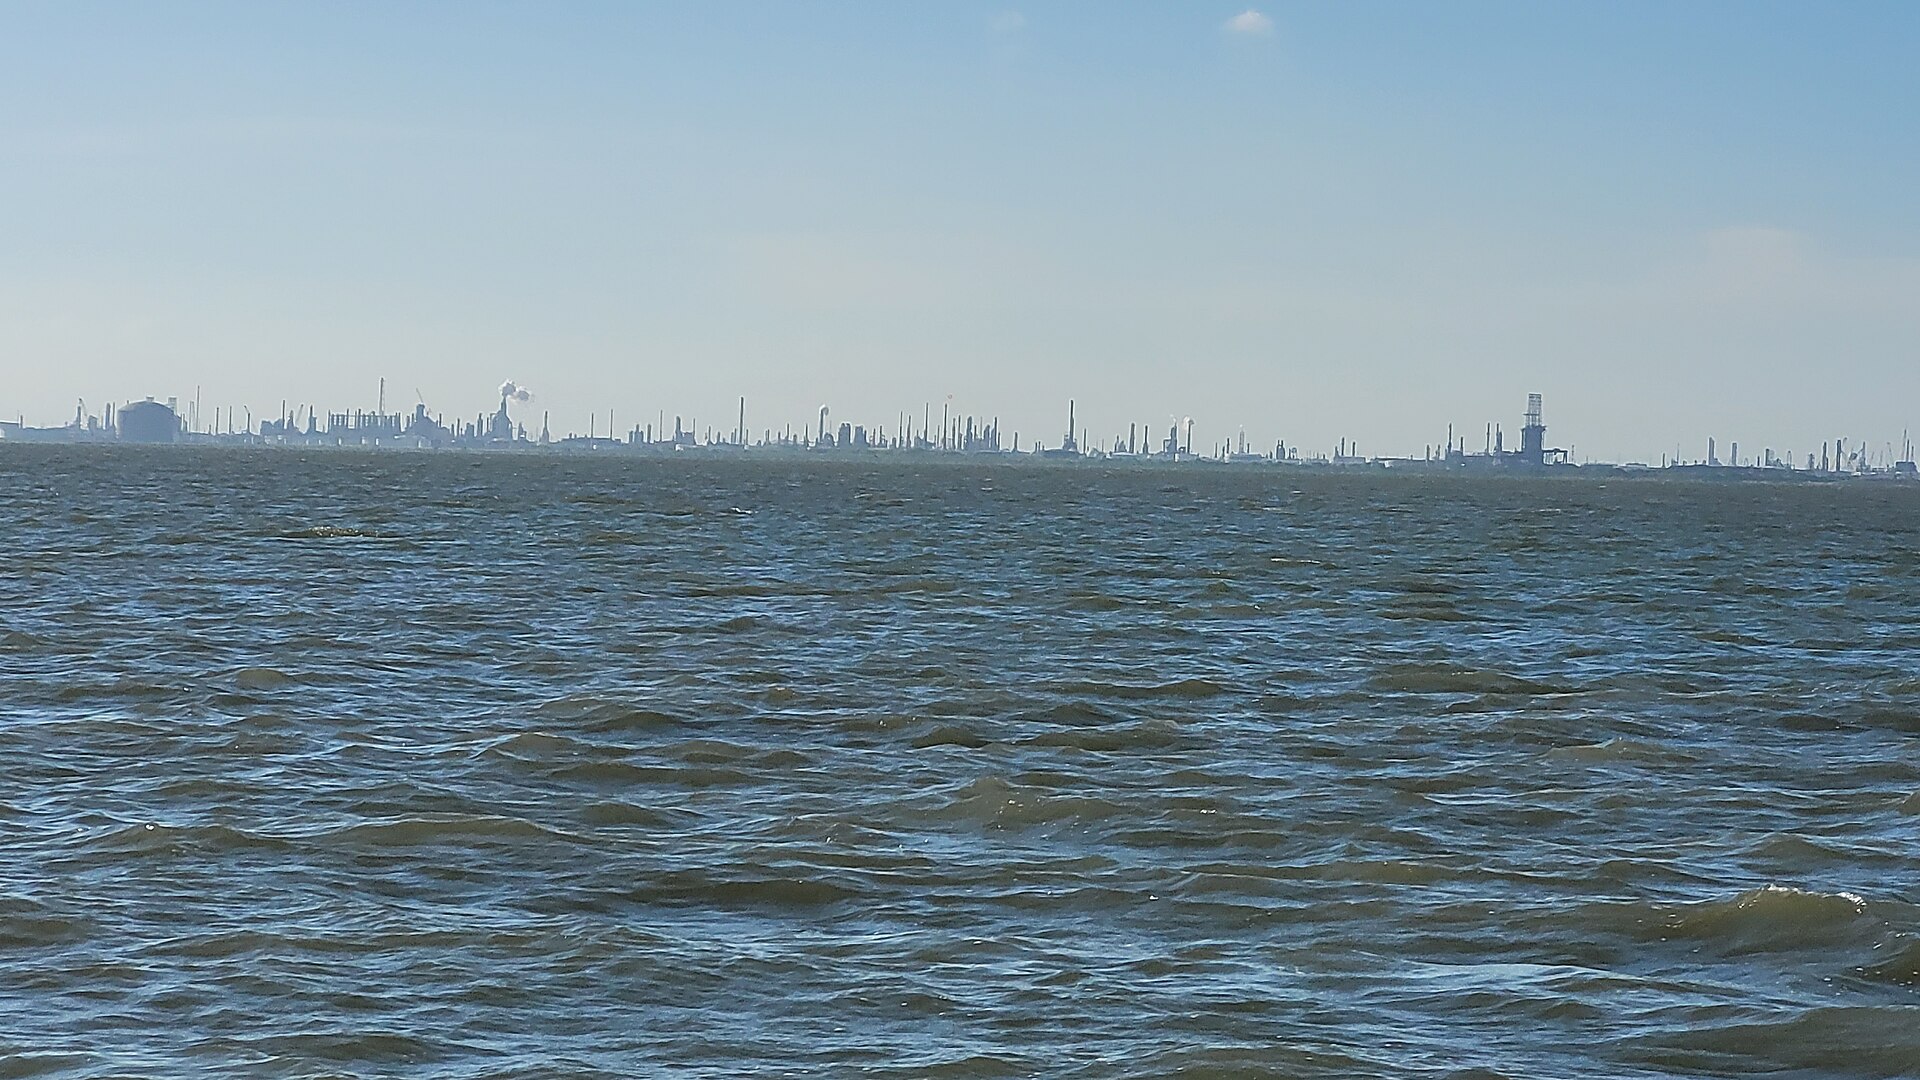
Geography helps too. Many refineries on the Gulf Coast, which the agency calls PADD 3, are built to process heavy, sulphur-rich crude of the kind Venezuela exports.
Kpler, a commodities data firm, adds that the closure of the Strait of Hormuz, the Gulf shipping chokepoint, in April cut off crude and heavy fuel oil from the Middle East to the US. It said Venezuela passed Saudi Arabia and Mexico in May to become the second-largest crude supplier to the US after Canada.
The same firm put Venezuela at 10% of total US crude imports, against 2% a year earlier. That is Kpler’s estimate, not an EIA figure.
From Sanctions to Gulf Coast Cargoes
US imports from Venezuela stopped shortly after Washington sanctioned the state oil company, Petróleos de Venezuela (PDVSA), in January 2019. In November 2022 the Treasury Department’s sanctions office let Chevron, the US oil major, resume exports from its Venezuelan joint ventures, and shipments restarted in January 2023.
The EIA says the US government eased restrictions on PDVSA after the capture of President Nicolás Maduro in January 2026. It adds that Venezuela has sent no crude to China this year, after sending most of its exports there in 2025, so the United States is now its largest single destination.
Live Market IntelligenceCommodities — Live Market Board
Rio Times · Live Market Intelligence
Commodities — Live Market Board
-3.03%
| Instrument | Last | Change | YoY | Prev. | High | Low | Volume |
|---|---|---|---|---|---|---|---|
| GOLD | 4,113 | +0.92% | -0.23% | 4,075 | 4,143 | 4,063 | 62,982 |
| SILVER | 52.65 | +1.64% | +4.93% | 51.80 | 53.47 | 51.42 | 16,569 |
| BRENT | 95.34 | -3.03% | +48.83% | 98.32 | 98.42 | 94.43 | 10,038 |
| WTI | 88.44 | -2.63% | +47.08% | 90.83 | 91.42 | 87.54 | 72,352 |
| COPPER | 6.32 | +1.70% | +24.32% | 6.22 | 6.36 | 6.24 | 14,068 |
| LITHIUM | 60.91 | +1.21% | +0.03% | 60.18 | 61.25 | 60.27 | 204,575 |
| IRON ORE | 161.91 | — | +55.73% | 161.91 | 161.91 | 1 | |
| SOY | 1,194 | +0.42% | +6.99% | 1,189 | 1,203 | 1,193 | 21,676 |
| CORN | 442.50 | +0.23% | +2.97% | 441.50 | 443.75 | 440.50 | 28,611 |
| WHEAT | 587.50 | -0.63% | +9.66% | 591.25 | 594.00 | 586.50 | 18,648 |
| COFFEE | 276.50 | -1.25% | -33.33% | 280.00 | 280.00 | 276.10 | 4,100 |
| SUGAR | 18.25 | +0.05% | +28.52% | 18.24 | 18.34 | 18.18 | 8,932 |
| COCOA | 5,238 | +1.61% | -14.16% | 5,155 | 5,343 | 5,199 | 2,557 |
| ORANGE JUICE | 130.55 | +1.63% | -28.15% | 128.45 | 140.35 | 135.75 | 440 |
| COTTON | 79.72 | +0.77% | +23.96% | 79.11 | 78.38 | 77.73 | 4,671 |
| BEEF | 214.05 | -0.16% | -6.34% | 214.40 | 214.60 | 210.85 | 34,881 |
| CATTLE | 322.33 | -0.84% | -3.97% | 325.05 | 320.35 | 312.05 | 14,677 |
| USD/BRL | 5.50 | -0.03% | +3.26% | 5.51 | 5.51 | 5.50 | — |
What It Means for US Readers
For drivers, the effect is indirect. Kpler says heavy grades like Venezuela’s feed refinery coking units, plants that turn heavy residue into fuels, but no pump-price effect has been measured.
For investors, the winners are Gulf Coast refiners with cheap access to heavy oil. The risk is that supply is political: our earlier report on October shipments falling more than 25% shows how quickly flows can shift.
What Is Not Known
The EIA gives no reason for August’s drop from 701,000 to 655,000 barrels a day. The EIA’s monthly figures for September are due on 30 November; a reading above 701,000 barrels a day would confirm a new high.
Weekly import numbers are preliminary and differ from the monthly series. If late cargoes land, the weekly data should show a rebound; if not, the July peak may stand for a while.
Frequently Asked Questions
How much Venezuelan oil did the US import in July 2026?
US imports of Venezuelan crude averaged 701,000 barrels a day in July, the most since May 2017, according to the US Energy Information Administration (EIA). Imports eased to 655,000 barrels a day in August.
Why are US imports from Venezuela rising?
The EIA cites strong refinery demand, high global refining margins and eased US restrictions on buying Venezuelan oil. Many Gulf Coast refineries are built to process heavy, sulphur-rich crude like Venezuela’s.
This article was produced by The Rio Times’ automated AI newsroom. Editorial responsibility: Matthias Camenzind, Publisher and Editor-in-Chief. The Rio Times also runs Ask Rio Times, which answers from 100,000+ of our own articles, the daily Latin America Power Map, and prediction-market odds on elections and markets.. How we use AI · Report an error
Venezuela and the United States
- What Is Going On Between Venezuela and the United States?
- What Is Going On Between Venezuela and the United States?
- Venezuela Geopolitics Explained, US Now Runs Its Oil
- Venezuela Politics 2026, Who Holds Power After Maduro