IBOV 206,911.89 ▲ 7.70% IPSA 11,124.65 ▲ 1.91% IPC MEX 64,327.79 ▼ 0.32% MERVAL 2,869,488 ▲ 3.68% COLCAP 2,582.65 ▲ 2.69% BVL PERÚ 59,860.04 ▲ 0.60% USD/BRL5.00▼ 4.11% USD/MXN18.07▼ 0.05% USD/CLP970.78▼ 1.99% USD/COP3,203▲ 0.30% USD/PEN3.44▼ 0.25% USD/ARS1,520▼ 0.02% USD/UYU40.34▲ 3.51% USD/PYG5,844▲ 3.40% USD/BOB11.95▲ 2.74% USD/DOP60.10▲ 0.33% USD/CRC455.71▲ 2.84% USD/GTQ7.63▲ 3.33% USD/HNL26.86▲ 3.48% USD/NIO36.62▲ 2.96% USD/VES870.21▼ 0.13% USD/PAB1.00— 0.00% USD/BZD2.00— 0.00% USD/JMD 157.28 — 0.00% USD/TTD6.68▼ 0.14% EUR/BRL5.61▼ 4.75% BRENT 88.88 ▼ 0.03% WTI 83.11 ▼ 0.11% IRON ORE 161.91 — — COPPER 6.61 ▲ 0.03% GOLD 4,461 ▲ 1.78% SILVER 65.59 ▲ 1.26% SOY 1,184 ▲ 3.20% CORN 480.50 ▲ 10.02% WHEAT 655.00 ▲ 3.93% COFFEE 317.25 ▼ 5.51% SUGAR 16.43 ▼ 1.79% ORANGE JUICE 138.55 ▼ 0.47% COTTON 85.03 ▲ 2.33% COCOA 5,719 ▲ 3.18% BEEF 223.60 ▼ 3.93% CATTLE 339.10 ▼ 3.16% LITHIUM 75.20 ▲ 1.47% PETR4 41.64 ▼ 0.05% VALE3 72.97 ▲ 0.83% ITUB4 38.60 ▼ 1.03% BBDC4 16.85 ▲ 0.36% ABEV3 14.89 ▼ 0.80% BBAS3 19.37 ▲ 0.47% B3SA3 14.26 ▼ 0.21% WEGE3 47.59 ▲ 0.49% PRIO3 59.14 ▼ 0.19% SUZB3 41.33 ▲ 2.35% RENT3 34.68 ▼ 0.09% AZZA3 15.89 ▼ 2.63% CSAN3 3.22 ▼ 1.83% RAIZ4 0.25 — 0.00% PCAR3 2.75 ▼ 0.36% GMAT3 3.65 ▼ 1.08% PSSA3 48.13 ▼ 0.54% CVCB3 1.33 ▼ 2.92% POSI3 3.36 ▲ 2.44% SLCE3 13.34 ▲ 0.30% NATU3 8.14 ▼ 0.73% IBOV 206,911.89 ▲ 7.70% IPSA 11,124.65 ▲ 1.91% IPC MEX 64,327.79 ▼ 0.32% MERVAL 2,869,488 ▲ 3.68% COLCAP 2,582.65 ▲ 2.69% BVL PERÚ 59,860.04 ▲ 0.60% USD/BRL 5.16 ▲ 0.01% USD/MXN 17.06 ▼ 0.24% USD/CLP 913.98 ▲ 0.04% USD/COP 3,140 ▲ 0.03% USD/PEN 3.36 ▼ 0.66% USD/ARS 1,493 ▲ 0.10% USD/UYU 40.27 ▲ 1.24% USD/PYG 5,939 ▲ 1.68% USD/BOB 11.64 ▼ 0.76% USD/DOP 58.34 ▲ 1.25% USD/CRC 445.92 ▲ 0.89% USD/GTQ 7.62 ▲ 2.21% USD/HNL 26.79 ▲ 1.57% USD/NIO 36.62 ▲ 0.69% USD/VES 762.44 ▼ 0.13% USD/PAB 1.00 — 0.00% USD/BZD 2.00 — 0.00% USD/JMD 157.28 — 0.00% USD/TTD 6.70 ▲ 0.61% EUR/BRL 5.95 ▲ 1.01% BRENT 88.88 ▼ 0.03% WTI 83.11 ▼ 0.11% IRON ORE 161.91 — — COPPER 6.61 ▲ 0.03% GOLD 4,461 ▲ 1.78% SILVER 65.59 ▲ 1.26% SOY 1,184 ▲ 3.20% CORN 480.50 ▲ 10.02% WHEAT 655.00 ▲ 3.93% COFFEE 317.25 ▼ 5.51% SUGAR 16.43 ▼ 1.79% ORANGE JUICE 138.55 ▼ 0.47% COTTON 85.03 ▲ 2.33% COCOA 5,719 ▲ 3.18% BEEF 223.60 ▼ 3.93% CATTLE 339.10 ▼ 3.16% LITHIUM 75.20 ▲ 1.47% PETR4 41.64 ▼ 0.05% VALE3 72.97 ▲ 0.83% ITUB4 38.60 ▼ 1.03% BBDC4 16.85 ▲ 0.36% ABEV3 14.89 ▼ 0.80% BBAS3 19.37 ▲ 0.47% B3SA3 14.26 ▼ 0.21% WEGE3 47.59 ▲ 0.49% PRIO3 59.14 ▼ 0.19% SUZB3 41.33 ▲ 2.35% RENT3 34.68 ▼ 0.09% AZZA3 15.89 ▼ 2.63% CSAN3 3.22 ▼ 1.83% RAIZ4 0.25 — 0.00% PCAR3 2.75 ▼ 0.36% GMAT3 3.65 ▼ 1.08% PSSA3 48.13 ▼ 0.54% CVCB3 1.33 ▼ 2.92% POSI3 3.36 ▲ 2.44% SLCE3 13.34 ▲ 0.30% NATU3 8.14 ▼ 0.73%
since 2009
Tuesday, October 6, 2026

Agri Business Brazil

São Paulo’s Agribusiness Exports Surge 5.8% in 2024, Bolstering State Economy

By · January 19, 2025 · 2 min read

The São Paulo state agribusiness sector demonstrated remarkable growth in 2024, with exports rising by 5.8% to achieve a trade surplus of R$ 150 ($25) billion. This information comes from the Secretariat of Agriculture and Supply, as reported by the São Paulo Agribusiness Technology Agency (Apta). The sector’s exports totaled R$ 184.7 billion, a 6.8% increase from 2023, accounting for 43.2% of the state’s total exports and 18.6% of Brazil’s agribusiness exports.

The sugar and ethanol complex led the way, contributing 40.1% of São Paulo’s agribusiness exports, valued at R$ 74.16 billion. Sugar dominated this segment, representing 93% of the complex’s exports, while ethanol accounted for 7%. The meat industry secured the second position, with an 11.6% share and revenue of $3.57 billion.

Forest products claimed the third spot, constituting 10.2% of exports and generating $3.14 billion. Cellulose was the primary product in this category, making up 54.9% of the sector’s exports, followed by paper at 37.4%. The juice sector, particularly orange juice, held a 9.6% share with $2.95 billion in exports.
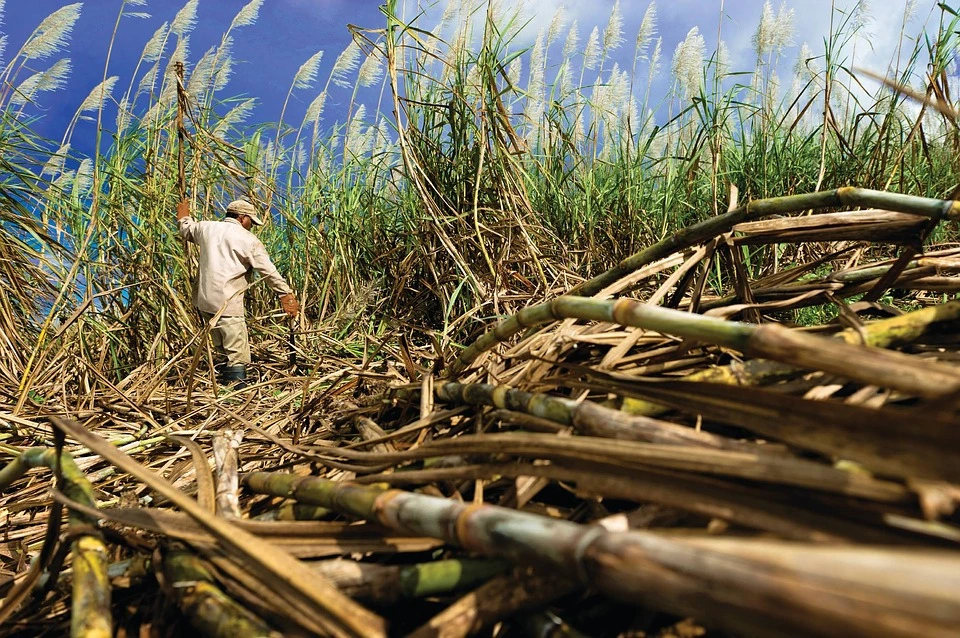
São Paulo's Agribusiness Exports Surge 5.8% in 2024, Bolstering State Economy.
São Paulo’s Agribusiness Exports Surge 5.8% in 2024, Bolstering State Economy.
RT
Ask Rio Times
Latin American markets, currencies and companies.
Open the full Ask Rio Times →

The soy complex rounded out the top five export groups, representing 7.4% of the total with $2.27 billion in exports. Soybeans in grain form accounted for 78.9% of this amount. These five groups collectively represented 78.9% of São Paulo’s sectoral exports.

Coffee, ranking sixth, maintained its international market relevance with total sales of $1.28 billion. Compared to the previous year, key product groups in São Paulo’s export portfolio showed significant growth.

The LatAm Brief

One email, every weekday morning. What moved in Latin American markets, politics and expat life.

Yesterday’s subject line: “Brazil runoff set: Flávio 47%, Lula 45%, 25 October”

Free. We send a confirmation link first — nothing arrives until you click it. Unsubscribe with one click in any edition. If you stop opening us for 30 days we stop sending by ourselves, as we assume the interest is no longer there. See our privacy policy. We never share your email.

São Paulo’s Agribusiness Exports Surge 5.8% in 2024, Bolstering State Economy

Coffee exports surged by 42.9%, followed by juices (29.7%), forest products (16.3%), meats (13.4%), and the sugar-ethanol complex (11.6%). China remained the primary market for São Paulo’s agribusiness, despite a 19.1% decrease in total value to R$ 35.57 billion.

The European Union secured the second position with R$ 23.45 billion, while the United States ranked third with R$ 20.8 billion, showing a 21.5% increase from the previous year. This robust performance of São Paulo’s agribusiness sector underscores its crucial role in driving economic growth and international trade.

The sector’s resilience and adaptability in the face of global market fluctuations highlight the state’s strong position in the agricultural export landscape.

This article was produced by The Rio Times’ automated newsroom system. How we use AI · Report an error · Editorial responsibility: Matthias Camenzind, Editor-in-Chief

The Rio Times · Power Map
See who really holds power in Latin America
Click to open the Power Map →

Rotate for Best Experience

This report is optimized for landscape viewing. Rotate your phone for the full experience.