From January to October, São Paulo’s agribusiness and farming achieved a remarkable US$ 18.59 billion trade surplus.
This value, over R$ 90.79 billion, shows a 6.5% increase from last year. The Institute of Agricultural Economics (IEA) provided these insights, highlighting the sector’s growth.
The surplus comes from a 5.1% boost in exports, reaching US$ 22.85 billion. Simultaneously, imports saw a 0.7% decline.
The IEA notes that São Paulo’s agribusiness exports make up 39.2% of all state exports. Meanwhile, imports in this sector constitute 7%.
Key groups lead São Paulo’s agribusiness exports. These groups account for 79.3% of total sales.
They include the sugar-alcohol complex, soy complex, meat sector, forestry products, and juice group. The sugar-alcohol complex alone brought in US$ 8.24 billion.
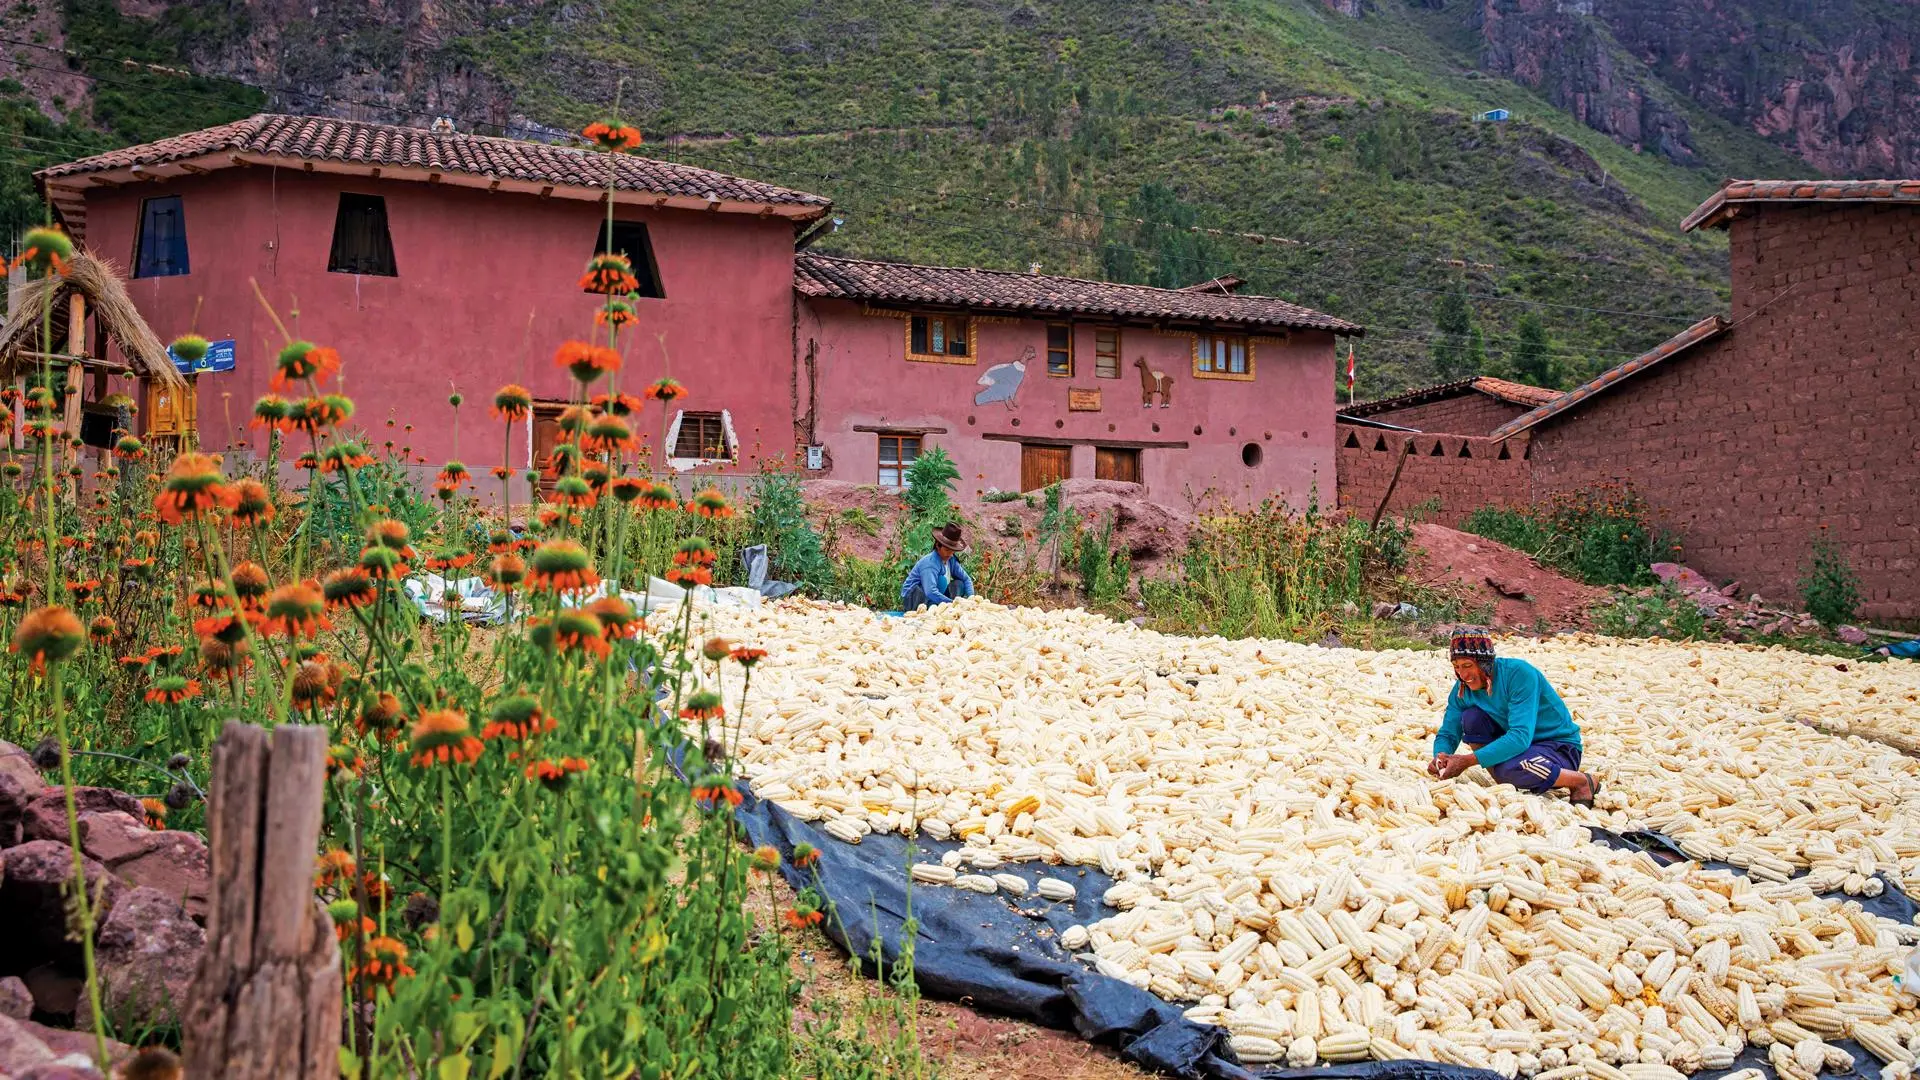
São Paulo’s agribusiness exports are a significant part of Brazil’s total. They represent 16.4%, a slight increase from the previous year.
The first ten months indicate potential record-breaking performance. Exports stood at US$ 25.98 billion, with a trade surplus of US$ 20.89 billion.
This trend suggests continued success for São Paulo’s agribusiness.
Background
São Paulo’s agribusiness success is not new. The state has a rich history in agriculture, contributing significantly to Brazil’s economy.
Its diverse climate and fertile land make it ideal for various crops. São Paulo is renowned for its sugar cane, coffee, and orange production.
These commodities have been pillars of its economy for decades.
In comparison to other Brazilian states, São Paulo stands out for its advanced agricultural technology and infrastructure.
This advancement has allowed for higher productivity and efficiency. The state’s focus on export-oriented agribusiness has also driven economic growth.
These factors position São Paulo as a leader in Brazilian agriculture.
Nationally, Brazil is a major player in the global agricultural market. São Paulo’s contribution is crucial to maintaining this status.
The recent trade surplus reflects Brazil’s broader agricultural strength. It also underscores the importance of agribusiness in national and global food security.
Looking forward, São Paulo’s agribusiness sector shows potential for continued growth.
Investments in sustainable practices and technological innovation could further enhance its global competitiveness.
This growth trajectory suggests that São Paulo will remain a key agricultural hub in Brazil and worldwide.
More: Brazil news in English, every day from The Rio Times.
Live Market IntelligenceBrazil — Live Market Board
Rio Times · Live Market Intelligence
Brazil — Live Market Board
-0.17%
205,079.25
-0.17%
68,969.69
+0.06%
10,972.40
+0.02%
3,017,221
—
2,521.34
-1.75%
59,664.64
+0.40%
| Instrument | Last | Change | YoY | Prev. | High | Low | Volume |
|---|---|---|---|---|---|---|---|
| IBOV | 205,079.25 | -0.17% | +21.85% | 205,430.33 | 168,310 | 167,142 | — |
| USD/BRL | 5.16 | +0.01% | -5.13% | 5.16 | 5.18 | 5.14 | — |
| SELIC | 14.00% | — | — | — | — | — | |
| PETR4 | 41.64 | -0.05% | +35.19% | 41.66 | 41.97 | 41.15 | 41,499,400 |
| VALE3 | 72.97 | +0.83% | +30.75% | 72.37 | 73.54 | 72.66 | 17,658,000 |
| ITUB4 | 38.60 | -1.03% | +4.57% | 39.00 | 39.34 | 38.39 | 29,487,800 |
| BBDC4 | 16.85 | +0.36% | +3.50% | 16.79 | 16.90 | 16.67 | 19,416,900 |
| BBAS3 | 19.37 | +0.47% | +0.73% | 19.28 | 19.44 | 19.16 | 11,069,200 |
| B3SA3 | 14.26 | -0.21% | +12.73% | 14.29 | 14.47 | 14.11 | 33,037,800 |
| ABEV3 | 14.89 | -0.80% | +21.91% | 15.01 | 15.07 | 14.81 | 16,453,100 |
| WEGE3 | 47.59 | +0.49% | +29.99% | 47.36 | 48.08 | 47.36 | 3,364,600 |
| PRIO3 | 59.14 | -0.19% | +50.67% | 59.25 | 59.81 | 58.74 | 3,325,600 |
| SUZB3 | 41.33 | +2.35% | -23.55% | 40.38 | 41.48 | 40.35 | 3,914,900 |
| RENT3 | 34.68 | -0.09% | +0.84% | 34.71 | 34.96 | 34.35 | 7,979,100 |
| AZZA3 | 15.89 | -2.63% | -53.76% | 16.32 | 16.42 | 15.82 | 1,330,300 |
| CSNA3 | 4.30 | +0.47% | -42.65% | 4.28 | 4.41 | 4.26 | 10,076,100 |
| GGBR4 | 24.69 | +2.19% | +51.38% | 24.16 | 24.85 | 24.18 | 7,047,600 |
| ENEV3 | 24.21 | -1.38% | +70.49% | 24.55 | 24.64 | 23.99 | 9,297,000 |
This article was produced by The Rio Times’ automated newsroom system. How we use AI · Report an error · Editorial responsibility: Matthias Camenzind, Editor-in-Chief
Living in or visiting São Paulo? See this month's events and our São Paulo city guide with rents, safety and upcoming concerts.