IBOV 186,595.60 ▲ 0.74% IPSA 11,357.82 ▼ 0.21% IPC MEX 63,133.88 ▼ 0.38% MERVAL 2,998,956 ▼ 0.76% COLCAP 2,565.55 ▲ 0.68% BVL PERÚ 59,344.04 ▲ 0.31% USD/BRL5.11▼ 0.58% USD/MXN17.21▼ 0.09% USD/CLP946.95▼ 1.30% USD/COP3,193▲ 0.57% USD/PEN3.37▼ 0.09% USD/ARS1,514▼ 0.03% USD/UYU40.14▼ 0.05% USD/PYG5,926▲ 0.34% USD/BOB10.95▲ 10.05% USD/DOP59.26▲ 0.87% USD/CRC443.27▼ 0.27% USD/GTQ7.63▼ 0.05% USD/HNL26.86▲ 0.03% USD/NIO36.62— 0.00% USD/VES847.44▼ 0.13% USD/PAB1.00— 0.00% USD/BZD2.00— 0.00% USD/JMD 157.28 — 0.00% USD/TTD6.76▲ 0.17% EUR/BRL5.86▼ 0.87% BRENT 88.88 ▼ 0.03% WTI 83.11 ▼ 0.11% IRON ORE 161.91 — — COPPER 6.61 ▲ 0.03% GOLD 4,461 ▲ 1.78% SILVER 65.59 ▲ 1.26% SOY 1,184 ▲ 3.20% CORN 480.50 ▲ 10.02% WHEAT 655.00 ▲ 3.93% COFFEE 317.25 ▼ 5.51% SUGAR 16.43 ▼ 1.79% ORANGE JUICE 138.55 ▼ 0.47% COTTON 85.03 ▲ 2.33% COCOA 5,719 ▲ 3.18% BEEF 223.60 ▼ 3.93% CATTLE 339.10 ▼ 3.16% LITHIUM 75.20 ▲ 1.47% PETR4 41.64 ▼ 0.05% VALE3 72.97 ▲ 0.83% ITUB4 38.60 ▼ 1.03% BBDC4 16.85 ▲ 0.36% ABEV3 14.89 ▼ 0.80% BBAS3 19.37 ▲ 0.47% B3SA3 14.26 ▼ 0.21% WEGE3 47.59 ▲ 0.49% PRIO3 59.14 ▼ 0.19% SUZB3 41.33 ▲ 2.35% RENT3 34.68 ▼ 0.09% AZZA3 15.89 ▼ 2.63% CSAN3 3.22 ▼ 1.83% RAIZ4 0.25 — 0.00% PCAR3 2.75 ▼ 0.36% GMAT3 3.65 ▼ 1.08% PSSA3 48.13 ▼ 0.54% CVCB3 1.33 ▼ 2.92% POSI3 3.36 ▲ 2.44% SLCE3 13.34 ▲ 0.30% NATU3 8.14 ▼ 0.73% IBOV 186,595.60 ▲ 0.74% IPSA 11,357.82 ▼ 0.21% IPC MEX 63,133.88 ▼ 0.38% MERVAL 2,998,956 ▼ 0.76% COLCAP 2,565.55 ▲ 0.68% BVL PERÚ 59,344.04 ▲ 0.31% USD/BRL 5.16 ▲ 0.01% USD/MXN 17.06 ▼ 0.24% USD/CLP 913.98 ▲ 0.04% USD/COP 3,140 ▲ 0.03% USD/PEN 3.36 ▼ 0.66% USD/ARS 1,493 ▲ 0.10% USD/UYU 40.27 ▲ 1.24% USD/PYG 5,939 ▲ 1.68% USD/BOB 11.64 ▼ 0.76% USD/DOP 58.34 ▲ 1.25% USD/CRC 445.92 ▲ 0.89% USD/GTQ 7.62 ▲ 2.21% USD/HNL 26.79 ▲ 1.57% USD/NIO 36.62 ▲ 0.69% USD/VES 762.44 ▼ 0.13% USD/PAB 1.00 — 0.00% USD/BZD 2.00 — 0.00% USD/JMD 157.28 — 0.00% USD/TTD 6.70 ▲ 0.61% EUR/BRL 5.95 ▲ 1.01% BRENT 88.88 ▼ 0.03% WTI 83.11 ▼ 0.11% IRON ORE 161.91 — — COPPER 6.61 ▲ 0.03% GOLD 4,461 ▲ 1.78% SILVER 65.59 ▲ 1.26% SOY 1,184 ▲ 3.20% CORN 480.50 ▲ 10.02% WHEAT 655.00 ▲ 3.93% COFFEE 317.25 ▼ 5.51% SUGAR 16.43 ▼ 1.79% ORANGE JUICE 138.55 ▼ 0.47% COTTON 85.03 ▲ 2.33% COCOA 5,719 ▲ 3.18% BEEF 223.60 ▼ 3.93% CATTLE 339.10 ▼ 3.16% LITHIUM 75.20 ▲ 1.47% PETR4 41.64 ▼ 0.05% VALE3 72.97 ▲ 0.83% ITUB4 38.60 ▼ 1.03% BBDC4 16.85 ▲ 0.36% ABEV3 14.89 ▼ 0.80% BBAS3 19.37 ▲ 0.47% B3SA3 14.26 ▼ 0.21% WEGE3 47.59 ▲ 0.49% PRIO3 59.14 ▼ 0.19% SUZB3 41.33 ▲ 2.35% RENT3 34.68 ▼ 0.09% AZZA3 15.89 ▼ 2.63% CSAN3 3.22 ▼ 1.83% RAIZ4 0.25 — 0.00% PCAR3 2.75 ▼ 0.36% GMAT3 3.65 ▼ 1.08% PSSA3 48.13 ▼ 0.54% CVCB3 1.33 ▼ 2.92% POSI3 3.36 ▲ 2.44% SLCE3 13.34 ▲ 0.30% NATU3 8.14 ▼ 0.73%
since 2009
Monday, September 21, 2026

São Paulo Life & Society

São Paulo Developer Eztec Reports Record Revenue

By · November 1, 2024 · 2 min read

The LatAm Brief

One email, every weekday morning. What moved in Latin American markets, politics and expat life.

Yesterday’s subject line: “Venezuela's New York week: oil signed, the bounty stays”

Free. We send a confirmation link first — nothing arrives until you click it. Unsubscribe with one click in any edition. If you stop opening us for 30 days we stop sending by ourselves, as we assume the interest is no longer there. See our privacy policy. We never share your email.

In the third quarter of 2024, Eztec, a prominent São Paulo-based real estate developer, reported a remarkable surge in profits. The company’s net income reached R$ 132.6 million ($23.3 million), a staggering 239% increase from the same period in 2023.

This impressive growth stems from various factors. Eztec’s net revenue hit a record R$ 478.8 million ($84 million), up 90.2% year-over-year.

The boost came from increased sales volume and construction progress. The company’s EBIT also saw a significant rise, reaching R$ 123.2 million ($21.6 million).

Eztec managed to reduce its operating expenses by 21.3% to R$ 39.5 million ($6.9 million). Commercial expenses dropped 11.6% due to lower spending on showrooms and advertising.

Administrative expenses, however, increased slightly by 2.6%. The company’s equity income, which reflects results from joint ventures, generated R$ 29.4 million ($5.2 million) in revenue, a 106% increase.
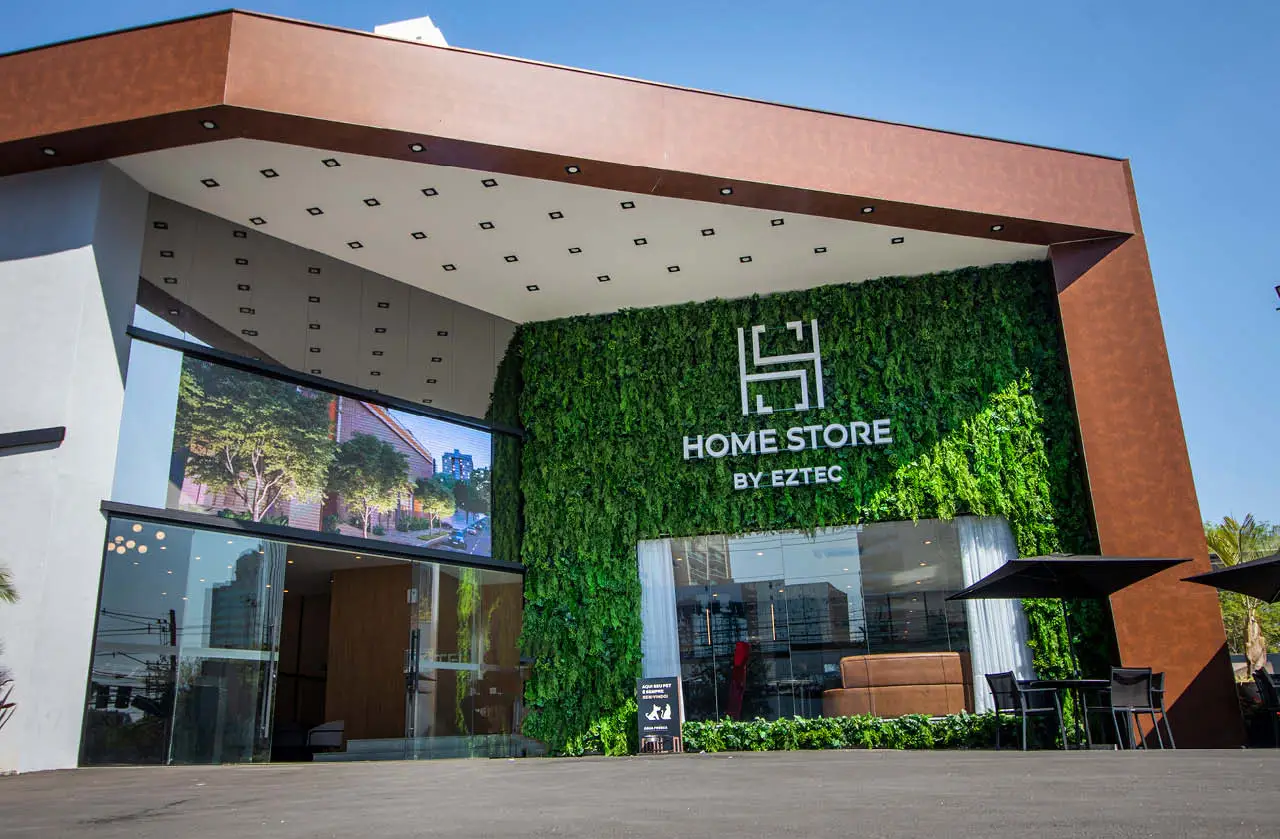
São Paulo Developer Eztec Reports Record Revenue
São Paulo Developer Eztec Reports Record Revenue.
One-stop reference
Company Intelligence
Every listed company in Latin America — financials, ownership and structure for 1,450+ companies across 26 exchanges, in one place.
Browse the directory →
RT
Ask Rio Times
Latin American markets, currencies and companies.
Open the full Ask Rio Times →

Financial results improved significantly, with revenue of R$ 36.9 million ($6.5 million), up 169.4% year-over-year.

Eztec’s Financial Performance

Eztec’s gross margin improved to 34.0%, while the net margin jumped to 27.7%. These improvements reflect increased revenues and reduced expenses.

The company also benefited from higher prices for new sales at its Lindenberg Ibirapuera residential project. Despite these positive results, Eztec reported a cash burn of R$ 57.8 million ($10.1 million) in the quarter.

Net debt rose to R$ 180.5 million ($31.7 million) at the end of September, up from R$ 18.5 million ($3.2 million) a year earlier.

The company significantly expanded its launches and sales in the third quarter. Eztec launched two projects valued at R$ 694.1 million ($121.8 million), an eightfold increase from the same period in 2023.

Net sales reached R$501 million ($87.9 million), up 79.9% year-over-year. These results demonstrate Eztec’s ability to navigate Brazil’s complex real estate market.

The company’s success highlights the potential for growth in the sector, even amidst economic challenges. As Eztec continues to adapt and expand, it sets an example for other players in the industry.

This article was produced by The Rio Times’ automated newsroom system. How we use AI · Report an error

LatAm Markets: Live Signals → — real-time movers, turnover leaders and FX across Latin America.

Read More from The Rio Times

The Rio Times · Power Map
See who really holds power in Latin America
Click to open the Power Map

Rotate for Best Experience

This report is optimized for landscape viewing. Rotate your phone for the full experience.