Post-Pandemic: Debt of World’s Poorest Will Explode in Five Years
RIO DE JANEIRO, BRAZIL – While the poor run into debt, the wealthy save more.
The trend that governments and Central Banks have been pursuing since the start of the coronavirus crisis may have been undermined for the time being, but the chances are high for a worsening scenario after the end of emergency aid to companies and the vulnerable.
The alert is provided by an Oxford Economics report, which sees the risk of a sharp deterioration in the global inequality scenario over the next five years due to the pandemic.

This trend has been fuelled since the 1980s by the strong migration of income to the wealthier section of the population, on the one hand, and by the growing indebtedness of the poorer families, on the other.
“The poorest families spend more of their income on essential goods such as housing and basic foodstuffs. When their income drops, they are still forced to spend on what is necessary and are therefore often forced into debt,” it says.
The wealthy, on the other hand, typically use up almost the maximum capacity of their consumption desires, so any additional income is saved for future support.
In addition, “evidence from past pandemics points to an increase in income inequality since the burden of economic adjustment falls disproportionately on low-skilled workers,” the paper says.
In pandemic contexts, low-skilled work is also more often undermined by isolation policies that impair confidence in the use of in-person services.
“A unique feature of this pandemic is that the ability to work from home is proving to be a key factor in determining job losses,” says Oxford Economics.
In other words, the most threatened jobs are those that cannot easily be performed at home (e.g. restaurants) and are also typically underpaid.
The losses among the poorest were also the greatest during the 2008 global financial crisis.
The effect is perpetual
There are three ways to describe inequality in a society, explains the consultancy:
- Income, which has far-reaching short-term implications;
- Wealth, which results in a deepening division over time: income is generated and often consumed during the lifetime of a family; wealth, however, can be inherited and passed on from generation to generation.
- Consumption, which shows how consumption of goods and services is spread throughout the economy: The drop in consumer spending in recent months has been much greater for higher-income groups, as more spending can be deferred.
This latter way of measuring inequality is relevant because spending is often smoothed out over an individual’s lifetime by means of loans, savings, and emergency aid and therefore may differ from income at times.
High-income households are still spending 11 percent below pre-coronavirus trends, compared with a high of two percent among the poorest.
Historical
Income inequality has grown substantially since the 1980s in advanced economies, particularly in the United Kingdom and the United States, after technological changes in the labor market and the fragility of labor unions, says the consultancy:
Between the early 1980s and 2017, the share of income held by the top one percent doubled from 11 percent in the US and six percent in the UK to 21 and 13 percent, respectively.
Over the past three decades, the distribution of wealth in France, the United Kingdom and the US has also become even more slanted towards the top of the social pyramid. On average, the poorest 50 percent held only six percent of total wealth in the mid-1980s; by 2014, this had halved to only three percent.
During that period, the wealth of the richest ten percent grew rapidly from 53 to 71 percent.
The graph below shows a sharp increase in revenues (red line) to the wealthiest one percent since the 1980s, which contributed to debt (blue line) reaching levels unseen since World War II:
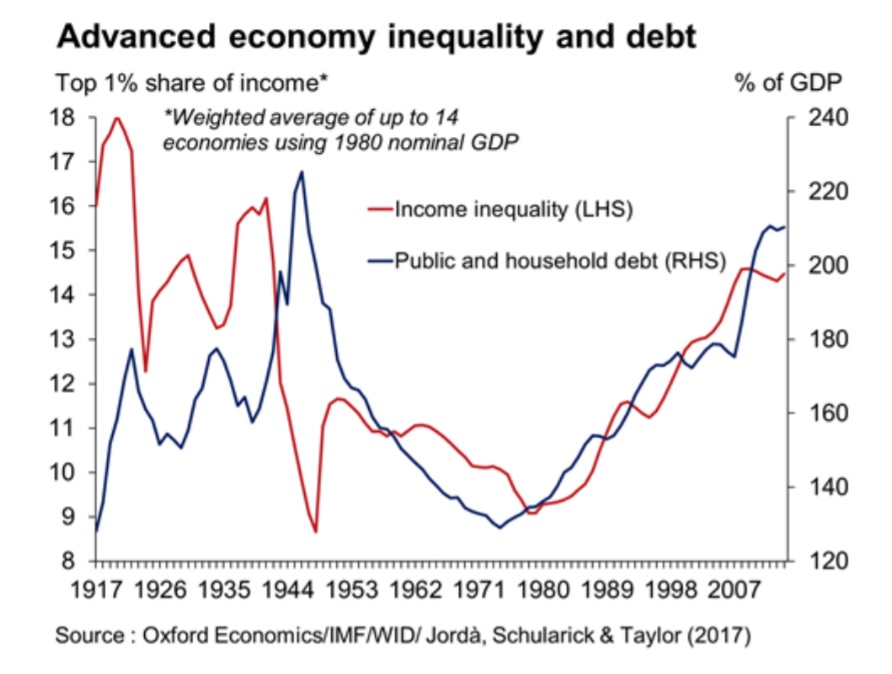
Source: Exame
More: Brazil news in English, every day from The Rio Times.
This article was produced by The Rio Times’ automated AI newsroom. Editorial responsibility: Matthias Camenzind, Publisher and Editor-in-Chief. The Rio Times also runs Ask Rio Times, which answers from 100,000+ of our own articles, the daily Latin America Power Map, and prediction-market odds on elections and markets.. How we use AI · Report an error