IBOV 183,827.59 ▲ 0.46% IPSA 11,055.91 ▼ 0.73% IPC MEX 65,071.30 ▲ 0.20% MERVAL 2,782,561 ▼ 0.59% COLCAP 2,558.92 ▼ 0.79% BVL PERÚ 60,220.45 ▲ 0.32% USD/BRL5.20▼ 0.43% USD/MXN18.08▲ 0.50% USD/CLP972.08▲ 0.38% USD/COP3,323▲ 0.62% USD/PEN3.44▲ 0.01% USD/ARS1,524▼ 0.05% USD/UYU40.27▲ 3.67% USD/PYG5,843▲ 2.30% USD/BOB11.96▲ 0.45% USD/DOP59.40▲ 2.98% USD/CRC452.68▲ 2.68% USD/GTQ7.64▲ 3.13% USD/HNL26.87▲ 3.23% USD/NIO36.62▲ 2.65% USD/VES856.92▲ 0.01% USD/PAB1.00— 0.00% USD/BZD2.00— 0.00% USD/JMD 157.28 — 0.00% USD/TTD6.70▲ 1.64% EUR/BRL5.90▲ 0.06% BRENT 88.88 ▼ 0.03% WTI 83.11 ▼ 0.11% IRON ORE 161.91 — — COPPER 6.61 ▲ 0.03% GOLD 4,461 ▲ 1.78% SILVER 65.59 ▲ 1.26% SOY 1,184 ▲ 3.20% CORN 480.50 ▲ 10.02% WHEAT 655.00 ▲ 3.93% COFFEE 317.25 ▼ 5.51% SUGAR 16.43 ▼ 1.79% ORANGE JUICE 138.55 ▼ 0.47% COTTON 85.03 ▲ 2.33% COCOA 5,719 ▲ 3.18% BEEF 223.60 ▼ 3.93% CATTLE 339.10 ▼ 3.16% LITHIUM 75.20 ▲ 1.47% PETR4 41.64 ▼ 0.05% VALE3 72.97 ▲ 0.83% ITUB4 38.60 ▼ 1.03% BBDC4 16.85 ▲ 0.36% ABEV3 14.89 ▼ 0.80% BBAS3 19.37 ▲ 0.47% B3SA3 14.26 ▼ 0.21% WEGE3 47.59 ▲ 0.49% PRIO3 59.14 ▼ 0.19% SUZB3 41.33 ▲ 2.35% RENT3 34.68 ▼ 0.09% AZZA3 15.89 ▼ 2.63% CSAN3 3.22 ▼ 1.83% RAIZ4 0.25 — 0.00% PCAR3 2.75 ▼ 0.36% GMAT3 3.65 ▼ 1.08% PSSA3 48.13 ▼ 0.54% CVCB3 1.33 ▼ 2.92% POSI3 3.36 ▲ 2.44% SLCE3 13.34 ▲ 0.30% NATU3 8.14 ▼ 0.73% IBOV 183,827.59 ▲ 0.46% IPSA 11,055.91 ▼ 0.73% IPC MEX 65,071.30 ▲ 0.20% MERVAL 2,782,561 ▼ 0.59% COLCAP 2,558.92 ▼ 0.79% BVL PERÚ 60,220.45 ▲ 0.32% USD/BRL 5.16 ▲ 0.01% USD/MXN 17.06 ▼ 0.24% USD/CLP 913.98 ▲ 0.04% USD/COP 3,140 ▲ 0.03% USD/PEN 3.36 ▼ 0.66% USD/ARS 1,493 ▲ 0.10% USD/UYU 40.27 ▲ 1.24% USD/PYG 5,939 ▲ 1.68% USD/BOB 11.64 ▼ 0.76% USD/DOP 58.34 ▲ 1.25% USD/CRC 445.92 ▲ 0.89% USD/GTQ 7.62 ▲ 2.21% USD/HNL 26.79 ▲ 1.57% USD/NIO 36.62 ▲ 0.69% USD/VES 762.44 ▼ 0.13% USD/PAB 1.00 — 0.00% USD/BZD 2.00 — 0.00% USD/JMD 157.28 — 0.00% USD/TTD 6.70 ▲ 0.61% EUR/BRL 5.95 ▲ 1.01% BRENT 88.88 ▼ 0.03% WTI 83.11 ▼ 0.11% IRON ORE 161.91 — — COPPER 6.61 ▲ 0.03% GOLD 4,461 ▲ 1.78% SILVER 65.59 ▲ 1.26% SOY 1,184 ▲ 3.20% CORN 480.50 ▲ 10.02% WHEAT 655.00 ▲ 3.93% COFFEE 317.25 ▼ 5.51% SUGAR 16.43 ▼ 1.79% ORANGE JUICE 138.55 ▼ 0.47% COTTON 85.03 ▲ 2.33% COCOA 5,719 ▲ 3.18% BEEF 223.60 ▼ 3.93% CATTLE 339.10 ▼ 3.16% LITHIUM 75.20 ▲ 1.47% PETR4 41.64 ▼ 0.05% VALE3 72.97 ▲ 0.83% ITUB4 38.60 ▼ 1.03% BBDC4 16.85 ▲ 0.36% ABEV3 14.89 ▼ 0.80% BBAS3 19.37 ▲ 0.47% B3SA3 14.26 ▼ 0.21% WEGE3 47.59 ▲ 0.49% PRIO3 59.14 ▼ 0.19% SUZB3 41.33 ▲ 2.35% RENT3 34.68 ▼ 0.09% AZZA3 15.89 ▼ 2.63% CSAN3 3.22 ▼ 1.83% RAIZ4 0.25 — 0.00% PCAR3 2.75 ▼ 0.36% GMAT3 3.65 ▼ 1.08% PSSA3 48.13 ▼ 0.54% CVCB3 1.33 ▼ 2.92% POSI3 3.36 ▲ 2.44% SLCE3 13.34 ▲ 0.30% NATU3 8.14 ▼ 0.73%
since 2009
Wednesday, September 30, 2026

World North America

Philadelphia Factories Face Tough Summer as Orders and Jobs Drop in June

By · June 20, 2025 · 2 min read

The LatAm Brief

One email, every weekday morning. What moved in Latin American markets, politics and expat life.

Yesterday’s subject line: “Argentina gives Britain two weeks over Falklands oil”

Free. We send a confirmation link first — nothing arrives until you click it. Unsubscribe with one click in any edition. If you stop opening us for 30 days we stop sending by ourselves, as we assume the interest is no longer there. See our privacy policy. We never share your email.

The Philadelphia Federal Reserve’s June 2025 report shows that factories in eastern Pennsylvania, southern New Jersey, and Delaware are having a hard time.

The main manufacturing index stayed at -4.0, which means more companies are shrinking than growing. This is the third month in a row with negative numbers, and it’s worse than experts expected.

One of the most worrying signs is jobs. The employment index fell to -9.8 in June from 16.5 in May.

Free daily brief — no card needed
Get every North America story in one morning email
We build you a personalized brief around the topics you follow — free for 7 days. Love it? Your first month after that is US$1.

This means factories are not just slowing down hiring—they are actually letting workers go. If this keeps up, it could hurt families and local businesses that depend on these jobs.

Orders for new products also dropped. The new orders index fell to 2.3 from 7.5. This shows that demand for goods is barely growing.

Shipments, which are goods sent to customers, did improve a bit, but that’s not enough to make up for the weak orders.

Costs for materials and parts are still high, though they are not rising as fast as before.
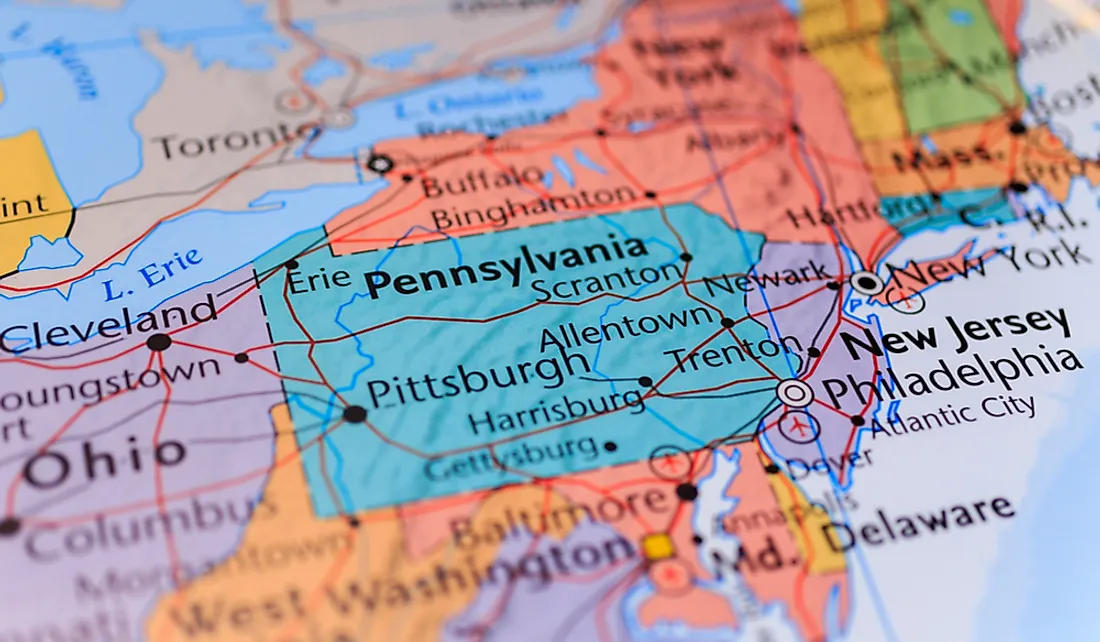
Philadelphia Factories Face Tough Summer as Orders and Jobs Drop in June
One-stop reference
Company Intelligence
Every listed company in Latin America — financials, ownership and structure for 1,450+ companies across 26 exchanges, in one place.
Browse the directory →
RT
Ask Rio Times
17 years of Latin America reporting, on demand.
Open the full Ask Rio Times →

Philadelphia Factories Face Tough Summer as Orders and Jobs Drop in June

The prices paid index dropped to 41.4 from 59.8, but that number is still well above normal. High costs make it harder for companies to make a profit or lower their prices.

Looking ahead, manufacturers are not feeling confident. The six-month outlook index dropped sharply to 18.3 from 47.2.

This means companies are less sure about the future and are cutting back on plans to spend money on new equipment or buildings.

The capital expenditures index fell to 14.5 from 27.0, a big drop in just one month.

The Philadelphia Fed’s survey is important because it often gives an early warning about the health of the wider U.S. economy.

When factories in this region struggle, it can signal problems for other parts of the country too.

This matters because manufacturing supports many jobs and businesses in the area. When factories slow down, the effects can spread to suppliers, truckers, and local shops.

Right now, the data shows that manufacturers are facing real challenges, and their decisions in the next few months will shape the economic outlook for the whole region.

All the numbers and facts in this story come directly from the official Philadelphia Federal Reserve report for June 2025.

This article was produced by The Rio Times’ automated newsroom system. How we use AI · Report an error

Read More from The Rio Times

The Rio Times · Power Map
See who really holds power in Latin America
Click to open the Power Map →

Rotate for Best Experience

This report is optimized for landscape viewing. Rotate your phone for the full experience.