IBOV 175,546.36 ▼ 1.23% IPSA 11,275.15 ▲ 1.05% IPC MEX 66,396.15 ▼ 0.19% MERVAL 3,100,732 ▼ 1.76% COLCAP 2,350.44 ▲ 0.24% BVL PERÚ 58,781.02 ▲ 0.81% USD/BRL5.11▼ 0.01% USD/MXN17.19▼ 0.20% USD/CLP915.30▲ 0.19% USD/COP3,151▼ 0.93% USD/PEN3.38▲ 0.14% USD/ARS1,500▲ 0.22% USD/UYU40.24▲ 1.43% USD/PYG5,919▲ 1.21% USD/BOB11.81▼ 1.30% USD/DOP58.19▼ 0.19% USD/CRC449.80▲ 1.97% USD/GTQ7.62▲ 2.32% USD/HNL26.78▲ 0.64% USD/NIO36.62▲ 0.75% USD/VES754.82▼ 0.13% USD/PAB1.00— 0.00% USD/BZD2.00— 0.00% USD/JMD157.89▲ 0.39% USD/TTD6.68▲ 0.41% EUR/BRL5.89▼ 0.70% BRENT 83.28 ▲ 0.96% WTI 77.84 ▲ 0.71% IRON ORE 161.91 — — COPPER 6.73 ▲ 0.70% GOLD 4,344 ▲ 2.41% SILVER 63.53 ▲ 3.40% SOY 1,183 ▲ 2.25% CORN 463.50 ▲ 5.58% WHEAT 631.50 ▲ 0.04% COFFEE 324.25 ▼ 0.81% SUGAR 15.58 ▲ 2.84% ORANGE JUICE 152.55 ▼ 3.27% COTTON 83.29 ▲ 1.77% COCOA 5,723 ▼ 2.70% BEEF 225.20 ▼ 3.83% CATTLE 341.75 ▼ 3.28% LITHIUM 72.41 ▼ 0.33% PETR4 42.13 ▲ 0.48% VALE3 75.39 ▼ 1.66% ITUB4 41.83 ▼ 1.30% BBDC4 17.70 ▼ 1.94% ABEV3 15.66 ▼ 1.14% BBAS3 20.28 ▼ 3.66% B3SA3 15.36 ▼ 1.22% WEGE3 48.40 ▼ 0.82% PRIO3 58.61 ▼ 1.00% SUZB3 41.97 ▼ 2.03% RENT3 38.16 ▼ 2.65% AZZA3 16.19 ▲ 1.44% CSAN3 3.79 ▼ 3.07% RAIZ4 0.26 — 0.00% PCAR3 2.90 ▼ 1.36% GMAT3 3.82 ▼ 1.80% PSSA3 52.65 ▼ 1.55% CVCB3 1.51 ▼ 2.58% POSI3 3.48 ▲ 0.58% SLCE3 13.21 ▼ 2.22% NATU3 8.18 ▼ 1.45% BRKM5 6.05 ▲ 3.07% RANI3 8.31 ▼ 0.95% CSNA3 4.74 ▼ 3.07% CMIN3 5.75 ▼ 2.54% USIM5 7.19 ▼ 3.62% GGBR4 25.65 ▼ 2.51% ENEV3 26.60 ▼ 1.41% CPFE3 45.85 ▼ 0.52% CMIG4 11.11 ▼ 1.24% EQTL3 38.43 ▼ 1.91% LREN3 13.48 ▼ 1.39% VIVT3 30.89 ▼ 1.03% RAIL3 13.71 ▼ 2.00% KLABIN 18.02 ▼ 3.33% RAIA DROGASIL 20.12 ▼ 2.09% RDOR3 34.06 ▼ 1.13% HAPV3 11.13 ▲ 0.18% FLRY3 17.27 ▼ 0.52% SMTO3 14.69 ▲ 2.73% UGPA3 32.75 ▲ 1.05% VBBR3 35.05 ▼ 0.11% BBSE3 40.96 ▲ 3.21% BPAC11 56.20 ▼ 1.07% CURY3 31.53 ▼ 1.56% AERI3 2.29 ▼ 0.43% VIVARA 21.81 ▼ 2.15% COMPASS 23.32 ▼ 3.72% VAMOS 3.11 ▼ 6.33% SANB11 29.27 ▼ 0.71% ASAI3 8.49 ▼ 3.85% SBSP3 27.39 ▼ 1.15% WALMEX 49.01 ▲ 0.99% GMEXICO 219.13 ▼ 1.46% FEMSA 210.07 ▼ 2.01% CEMEX 19.48 ▼ 2.40% GFNORTE 199.00 ▲ 0.04% BIMBO 60.64 ▼ 0.85% TELEVISA 9.80 ▲ 2.94% AMX 20.62 ▼ 0.82% GAP 382.00 ▲ 2.03% ASUR 277.72 ▲ 1.76% OMA 237.70 ▲ 0.68% KOF 188.00 ▲ 0.42% GRUMA 253.56 ▼ 1.37% KIMBER 40.15 ▼ 0.02% SQM-B 66,300 ▲ 3.67% COPEC 6,200 ▼ 1.40% BSANTANDER 81.06 ▲ 1.07% FALABELLA 6,400 ▲ 0.85% ENELAM 87.61 ▲ 0.64% CENCOSUD 2,060 ▲ 1.99% CMPC 1,030 ▼ 0.01% BANCO CHILE 191.70 ▲ 0.78% LATAM AIR 26.35 ▼ 0.11% YPF 7,840 ▲ 2.02% GGAL 7,385 ▼ 3.34% PAMPA 5,215 ▼ 1.79% TXAR 680.00 ▼ 0.15% ALUAR 931.00 ▼ 0.96% TGS 9,205 ▼ 0.43% CEPU 2,177 ▼ 3.80% MIRGOR 1,625 ▲ 0.31% COME 41.18 ▼ 0.65% LOMA NEGRA 3,380 ▼ 3.36% BYMA 290.00 ▲ 0.52% TELECOM ARG 4,343 ▲ 0.17% ECOPETROL 17.40 ▲ 6.16% BANCOLOMBIA 90.25 ▲ 0.12% GRUPO AVAL 5.11 ▼ 3.58% CREDICORP 392.56 ▼ 0.59% SOUTHERN COPPER 193.03 ▼ 2.02% BUENAVENTURA 32.57 ▼ 1.30% MERCADOLIBRE 1,830 ▼ 4.81% NUBANK 14.12 ▼ 2.49% XP 16.68 ▼ 1.77% PAGSEGURO 9.36 ▼ 0.43% STONE 11.08 ▼ 0.81% GLOBANT 37.24 ▼ 2.97% TECNOGLASS 44.47 ▼ 6.87% GAP AIRPORT 222.11 ▲ 2.11% ASUR 277.72 ▲ 1.76% OMA AIRPORT 111.21 ▲ 1.46% AMX ADR 23.91 ▼ 0.46% FEMSA ADR 122.15 ▼ 1.79% CEMEX ADR 11.30 ▼ 2.16% PETROBRAS ADR 18.52 ▲ 0.87% VALE ADR 14.72 ▼ 1.47% ITAU ADR 8.18 ▼ 0.37% SANTANDER BR 5.79 ▼ 0.09% AMBEV ADR 3.01 ▼ 0.66% CSN 0.94 ▼ 3.84% GERDAU 5.05 ▼ 1.83% LATAM ADR 57.45 ▼ 0.43% BTC 64,379 ▲ 0.18% ETH 1,905 ▲ 0.13% SOL 72.94 ▲ 0.50% XRP 1.03 ▼ 0.68% BNB 587.40 ▼ 0.72% ADA 0.20 ▲ 1.18% DOGE 0.07 ▲ 0.51% AVAX 6.43 ▼ 0.07% LINK 8.20 ▲ 0.22% DOT 0.82 ▼ 0.34% LTC 45.61 ▲ 0.46% BCH 215.47 ▲ 1.40% TRX 0.33 ▼ 0.04% XLM 0.16 ▲ 0.24% HBAR 0.07 — 0.00% NEAR 1.64 ▼ 0.93% ATOM 1.35 ▲ 0.18% AAVE 90.48 ▲ 1.00% SELIC 14.00% EMBRAER 91.65 ▼ 1.46% EMBRAER ADR 71.93 ▼ 1.17% JBS 13.69 ▼ 0.07% JBS BDR 69.90 ▼ 0.91% MBRF3 16.46 ▼ 1.85% MBRFY 3.24 ▲ 3.85% INTER 5.72 ▲ 0.18% IBOV 175,546.36 ▼ 1.23% IPSA 11,275.15 ▲ 1.05% IPC MEX 66,396.15 ▼ 0.19% MERVAL 3,100,732 ▼ 1.76% COLCAP 2,350.44 ▲ 0.24% BVL PERÚ 58,781.02 ▲ 0.81% USD/BRL 5.11 ▼ 0.01% USD/MXN 17.19 ▼ 0.18% USD/CLP 915.30 ▼ 0.06% USD/COP 3,151 ▼ 0.93% USD/PEN 3.38 ▲ 0.14% USD/ARS 1,500 ▲ 0.22% USD/UYU 40.24 ▲ 1.43% USD/PYG 5,919 ▲ 1.21% USD/BOB 11.81 ▼ 1.30% USD/DOP 58.19 ▼ 0.19% USD/CRC 449.80 ▲ 1.96% USD/GTQ 7.62 ▲ 2.32% USD/HNL 26.78 ▲ 0.64% USD/NIO 36.62 ▲ 0.75% USD/VES 754.82 ▼ 0.13% USD/PAB 1.00 — 0.00% USD/BZD 2.00 — 0.00% USD/JMD 157.89 ▲ 0.39% USD/TTD 6.68 ▲ 0.41% EUR/BRL 5.89 ▼ 0.70% BRENT 83.28 ▲ 0.96% WTI 77.84 ▲ 0.71% IRON ORE 161.91 — — COPPER 6.73 ▲ 0.70% GOLD 4,344 ▲ 2.41% SILVER 63.53 ▲ 3.40% SOY 1,183 ▲ 2.25% CORN 463.50 ▲ 5.58% WHEAT 631.50 ▲ 0.04% COFFEE 324.25 ▼ 0.81% SUGAR 15.58 ▲ 2.84% ORANGE JUICE 152.55 ▼ 3.27% COTTON 83.29 ▲ 1.77% COCOA 5,723 ▼ 2.70% BEEF 225.20 ▼ 3.83% CATTLE 341.75 ▼ 3.28% LITHIUM 72.41 ▼ 0.33% PETR4 42.13 ▲ 0.48% VALE3 75.39 ▼ 1.66% ITUB4 41.83 ▼ 1.30% BBDC4 17.70 ▼ 1.94% ABEV3 15.66 ▼ 1.14% BBAS3 20.28 ▼ 3.66% B3SA3 15.36 ▼ 1.22% WEGE3 48.40 ▼ 0.82% PRIO3 58.61 ▼ 1.00% SUZB3 41.97 ▼ 2.03% RENT3 38.16 ▼ 2.65% AZZA3 16.19 ▲ 1.44% CSAN3 3.79 ▼ 3.07% RAIZ4 0.26 — 0.00% PCAR3 2.90 ▼ 1.36% GMAT3 3.82 ▼ 1.80% PSSA3 52.65 ▼ 1.55% CVCB3 1.51 ▼ 2.58% POSI3 3.48 ▲ 0.58% SLCE3 13.21 ▼ 2.22% NATU3 8.18 ▼ 1.45% BRKM5 6.05 ▲ 3.07% RANI3 8.31 ▼ 0.95% CSNA3 4.74 ▼ 3.07% CMIN3 5.75 ▼ 2.54% USIM5 7.19 ▼ 3.62% GGBR4 25.65 ▼ 2.51% ENEV3 26.60 ▼ 1.41% CPFE3 45.85 ▼ 0.52% CMIG4 11.11 ▼ 1.24% EQTL3 38.43 ▼ 1.91% LREN3 13.48 ▼ 1.39% VIVT3 30.89 ▼ 1.03% RAIL3 13.71 ▼ 2.00% KLABIN 18.02 ▼ 3.33% RAIA DROGASIL 20.12 ▼ 2.09% RDOR3 34.06 ▼ 1.13% HAPV3 11.13 ▲ 0.18% FLRY3 17.27 ▼ 0.52% SMTO3 14.69 ▲ 2.73% UGPA3 32.75 ▲ 1.05% VBBR3 35.05 ▼ 0.11% BBSE3 40.96 ▲ 3.21% BPAC11 56.20 ▼ 1.07% CURY3 31.53 ▼ 1.56% AERI3 2.29 ▼ 0.43% VIVARA 21.81 ▼ 2.15% COMPASS 23.32 ▼ 3.72% VAMOS 3.11 ▼ 6.33% SANB11 29.27 ▼ 0.71% ASAI3 8.49 ▼ 3.85% SBSP3 27.39 ▼ 1.15% WALMEX 49.01 ▲ 0.99% GMEXICO 219.13 ▼ 1.46% FEMSA 210.07 ▼ 2.01% CEMEX 19.48 ▼ 2.40% GFNORTE 199.00 ▲ 0.04% BIMBO 60.64 ▼ 0.85% TELEVISA 9.80 ▲ 2.94% AMX 20.62 ▼ 0.82% GAP 382.00 ▲ 2.03% ASUR 277.72 ▲ 1.76% OMA 237.70 ▲ 0.68% KOF 188.00 ▲ 0.42% GRUMA 253.56 ▼ 1.37% KIMBER 40.15 ▼ 0.02% SQM-B 66,300 ▲ 3.67% COPEC 6,200 ▼ 1.40% BSANTANDER 81.06 ▲ 1.07% FALABELLA 6,400 ▲ 0.85% ENELAM 87.61 ▲ 0.64% CENCOSUD 2,060 ▲ 1.99% CMPC 1,030 ▼ 0.01% BANCO CHILE 191.70 ▲ 0.78% LATAM AIR 26.35 ▼ 0.11% YPF 7,840 ▲ 2.02% GGAL 7,385 ▼ 3.34% PAMPA 5,215 ▼ 1.79% TXAR 680.00 ▼ 0.15% ALUAR 931.00 ▼ 0.96% TGS 9,205 ▼ 0.43% CEPU 2,177 ▼ 3.80% MIRGOR 1,625 ▲ 0.31% COME 41.18 ▼ 0.65% LOMA NEGRA 3,380 ▼ 3.36% BYMA 290.00 ▲ 0.52% TELECOM ARG 4,343 ▲ 0.17% ECOPETROL 17.40 ▲ 6.16% BANCOLOMBIA 90.25 ▲ 0.12% GRUPO AVAL 5.11 ▼ 3.58% CREDICORP 392.56 ▼ 0.59% SOUTHERN COPPER 193.03 ▼ 2.02% BUENAVENTURA 32.57 ▼ 1.30% MERCADOLIBRE 1,830 ▼ 4.81% NUBANK 14.12 ▼ 2.49% XP 16.68 ▼ 1.77% PAGSEGURO 9.36 ▼ 0.43% STONE 11.08 ▼ 0.81% GLOBANT 37.24 ▼ 2.97% TECNOGLASS 44.47 ▼ 6.87% GAP AIRPORT 222.11 ▲ 2.11% ASUR 277.72 ▲ 1.76% OMA AIRPORT 111.21 ▲ 1.46% AMX ADR 23.91 ▼ 0.46% FEMSA ADR 122.15 ▼ 1.79% CEMEX ADR 11.30 ▼ 2.16% PETROBRAS ADR 18.52 ▲ 0.87% VALE ADR 14.72 ▼ 1.47% ITAU ADR 8.18 ▼ 0.37% SANTANDER BR 5.79 ▼ 0.09% AMBEV ADR 3.01 ▼ 0.66% CSN 0.94 ▼ 3.84% GERDAU 5.05 ▼ 1.83% LATAM ADR 57.45 ▼ 0.43% BTC 64,379 ▲ 0.18% ETH 1,905 ▲ 0.13% SOL 72.94 ▲ 0.50% XRP 1.03 ▼ 0.68% BNB 587.40 ▼ 0.72% ADA 0.20 ▲ 1.18% DOGE 0.07 ▲ 0.51% AVAX 6.43 ▼ 0.07% LINK 8.20 ▲ 0.22% DOT 0.82 ▼ 0.34% LTC 45.61 ▲ 0.46% BCH 215.47 ▲ 1.40% TRX 0.33 ▼ 0.04% XLM 0.16 ▲ 0.24% HBAR 0.07 — 0.00% NEAR 1.64 ▼ 0.93% ATOM 1.35 ▲ 0.18% AAVE 90.48 ▲ 1.00% SELIC 14.00% EMBRAER 91.65 ▼ 1.46% EMBRAER ADR 71.93 ▼ 1.17% JBS 13.69 ▼ 0.07% JBS BDR 69.90 ▼ 0.91% MBRF3 16.46 ▼ 1.85% MBRFY 3.24 ▲ 3.85% INTER 5.72 ▲ 0.18%
since 2009
Friday, August 7, 2026

Earnings Brazil

Petrobras Q2 2026 Results: Profit Nearly Doubles to US$10.4 Billion

Petrobras Q2 2026 results: net profit of R$52.4 billion, adjusted EBITDA of R$93.8 billion and R$17.4 billion in dividends and interest on equity.

By Richard Mann · August 7, 2026 · 6 min read

Daily Brief

The morning intel from across Latin America. Free.

By subscribing you agree to our privacy policy. We never share your email.

petrobras-20170525-0016
Business: Rio de Janeiro
Key Facts
Profit. Net income of R$52.4 billion (US$10.4 billion), ninety-seven percent above the second quarter of 2025.
EBITDA. Adjusted EBITDA of R$93.8 billion (US$18.6 billion); R$100.6 billion excluding one-off events.
Payout. R$17.4 billion in dividends and interest on equity, or R$1.34814262 per share.
Output. Record total production of 3.34 million barrels of oil equivalent a day and a record refinery utilisation factor.
State take. R$88.6 billion paid in taxes and government participations, about R$22 billion more than a year earlier.

The Petrobras Q2 2026 results, published after the São Paulo close on 6 August, show net income of R$52.4 billion, adjusted EBITDA of R$93.8 billion and R$17.4 billion approved for shareholders.
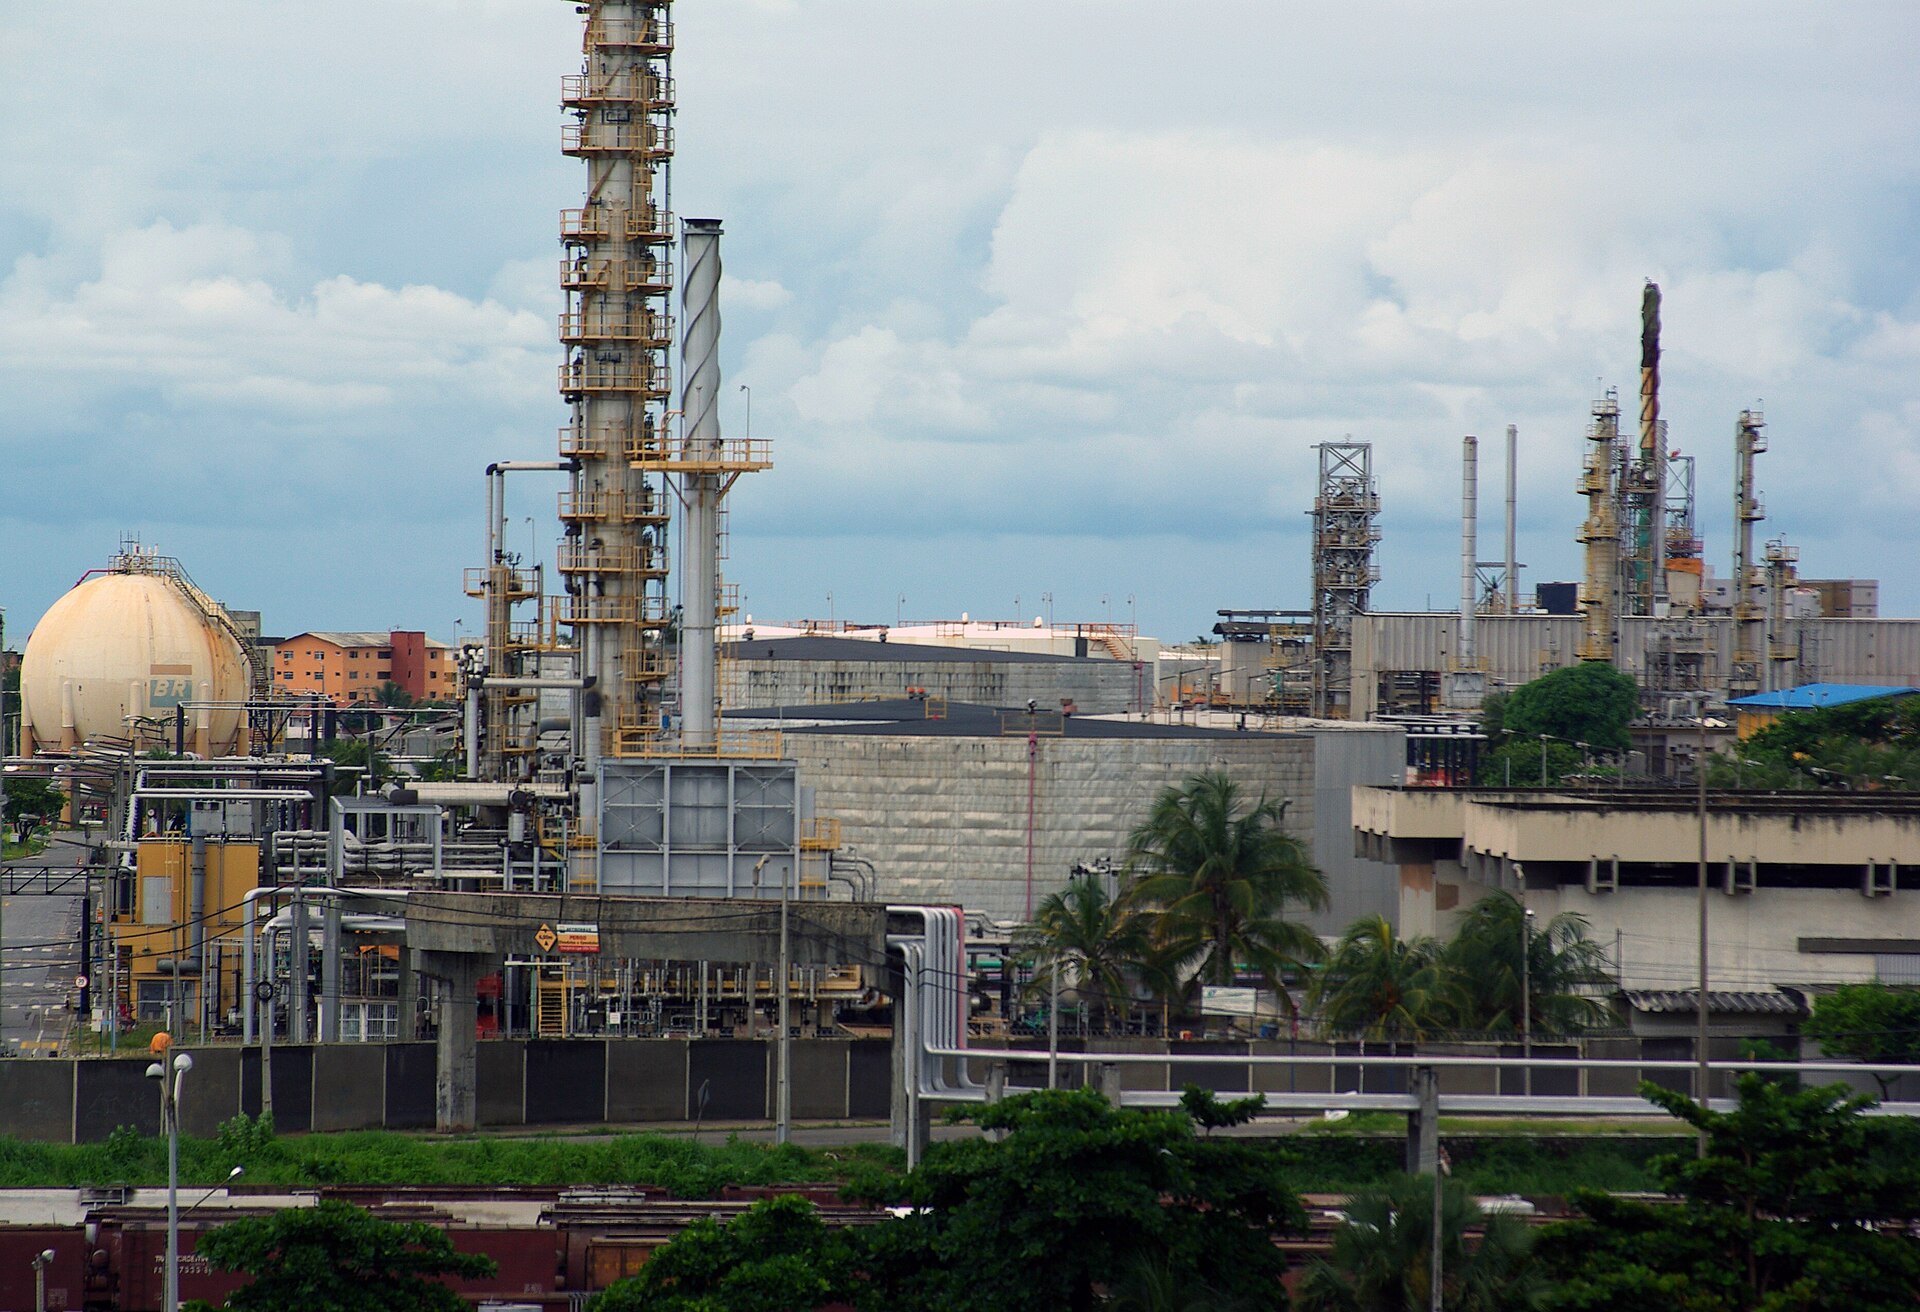
Petrobras Q2 2026 Results: Profit Nearly Doubles to US$10.4 Billion
RT
Ask Rio Times
Latin American markets, currencies and companies.
Open the full Ask Rio Times →

What the Petrobras Q2 2026 Results Showed

Petrobras reported net income of R$52.4 billion, equal to US$10.4 billion, for the three months to June. That is ninety-seven percent above the same quarter of 2025. Sales revenue reached R$169.5 billion, a gain of forty-two percent on the year.

Adjusted EBITDA came in at R$93.8 billion, or US$18.6 billion. Operating cash flow rose forty-six percent to R$61.8 billion and free cash flow roughly doubled, to R$38.6 billion. Stripping out what the company calls one-off events, net income was R$55.8 billion and adjusted EBITDA R$100.6 billion.

Own oil output in Brazil averaged 2.7 million barrels a day, fifteen percent above the year-earlier quarter, and total production set a record at 3.34 million barrels of oil equivalent a day. Refineries ran at record utilisation, lifting oil products output to 1.9 million barrels a day.

The Beat, and Why Its Size Is Disputed

The profit cleared expectations, but by how much depends on the survey used. One compilation put consensus net income near R$45.5 billion, another near R$50.8 billion, the latter also placing revenue almost exactly where it landed. Such surveys have a poor record here, and the first-quarter round was visibly wrong on revenue.

What is not disputed is that the operating lines came in closer to expectations than the profit line. Both compilations had adjusted EBITDA within a few percent of the reported R$93.8 billion. The wider gap at net income points to financial items, taxes and one-offs rather than to operations.

One-off events also worked against the company this time, trimming about R$3.4 billion from reported profit. That reverses the first quarter, when one-offs added close to R$9 billion and reported income ran well ahead of the recurring figure. The recurring number, not the headline, is the cleaner read on both quarters.

Live Company IntelligencePetroleo Brasileiro Petrobras SA ADR — the full investor dossierInside: live share price, market cap, three-year financials, valuation, ESG and peer benchmarks — plus the latest Rio Times coverage.
P
◆ Live Company Intelligence
Petroleo Brasileiro Petrobras
NYSE: PBRPETR4EnergyOil & Gas Integrated43,199 employees
$118.32B
Market cap
Analyst target $22.22

Wall Street view

4.4Buy/ 5
11 Buy3 Hold0 Sell
Avg. price target $22.22  ·  +36% vs 200-day

Valuation & profitability

Market cap$118.32B
Revenue (TTM)$498.09B
P / E ratio5.8
Profit margin21.6%
Return on equity25.6%

Price & risk

52-wk low
$10.97
52-wk high
$22.07
Beta (volatility)-0.22
200-day average$16.29

Revenue trend · 6y

20202025
Latest $88.10B

Ownership

Institutions21.6%
Shares outstanding3.72B
Top holderGQG Partners LLC
Institutional holders5+ funds

Dividend

Yield16.0%
Payout ratio37.0%
Fwd. annual$1.76
What Petroleo Brasileiro Petrobras does. Petróleo Brasileiro S.A. – Petrobras explores, produces, and sells oil and gas in Brazil, China, the United States, the Americas, Asia, Europe, Singapore, and internationally. It operates through three segments: Exploration and Production; Refining, Transportation & Marketing; and Gas & Low Carbon Energies. The Exploration and Production segment explores, develops, and produces…
Data: EODHD fundamentals (PBR.US) · figures in USD · as of 6 Aug 2026More company intelligence →

The Payout Was Formula, Not Generosity

The board approved R$17.4 billion in dividends and interest on equity, equal to R$1.34814262 per share. Holders on the B3 register at the close on 21 August qualify and the shares trade ex-entitlement from 24 August, while the record date for New York-listed ADRs is 25 August. Payment comes in two equal instalments, on 23 November and 21 December.

That sum was not discretionary. Petrobras distributes forty-five percent of free cash flow when gross debt sits at or below its plan ceiling, and forty-five percent of the R$38.6 billion generated in the quarter lands within a rounding error of the approved figure. Estimates beforehand ran from about R$12.8 billion to R$17.9 billion, clearing most houses but not the most bullish.

Set that against the R$88.6 billion paid in taxes and government participations over the same three months. The state collected roughly five times as much through the fiscal channel as all shareholders received through the payout, and more than three times the R$26.7 billion the company invested.

Brent Rose Faster Than Prices at Home

Brent averaged US$104.52 a barrel over the quarter against US$67.82 a year earlier, a gain of fifty-four percent. The average price of basic oil products sold by Petrobras in the domestic market rose twenty-three percent over the same period, to R$578.51 a barrel.

Domestic pricing therefore captured well under half the move in crude. Part of that reflects the lag between shipment and revenue recognition flagged after the first quarter, and part the smoothing built into its fuel pricing approach. With a general election due in October, that gap is a political variable as much as a commercial one.

Leverage Fell, But Debt Barely Moved

Gross debt closed June at US$70.8 billion, below the US$75 billion ceiling in the 2026-2030 business plan and down under one percent on the quarter. Net debt ended at US$60.4 billion, a fall of under three percent. Leverage, measured against trailing twelve-month adjusted EBITDA, dropped from 1.43 times to 1.14 times.

Almost ninety percent of that improvement came from the denominator, not the balance sheet. Trailing EBITDA rose about twenty-two percent; had it stayed flat, the ratio would have barely moved. A leverage number driven by earnings is only as durable as the oil price behind it, and Brent has already fallen sharply from the quarterly average.

Cash generation carried a drag the company disclosed: a working capital movement of about R$15.8 billion, mainly higher receivables and lower payables. Without it, free cash flow would have been nearer R$54 billion, and the formula-driven payout correspondingly larger. Part of that balance is fuel compensation credits still booked as receivables.

Frequently Asked Questions

What did the Petrobras Q2 2026 results show?

Petrobras reported net income of R$52.4 billion, equal to US$10.4 billion, ninety-seven percent above the second quarter of 2025. Adjusted EBITDA was R$93.8 billion and sales revenue R$169.5 billion. Excluding one-off events, net income was R$55.8 billion and adjusted EBITDA R$100.6 billion.

How much is Petrobras paying shareholders?

The board approved R$17.4 billion in dividends and interest on equity, or R$1.34814262 per common and preferred share. Shareholders on the register at the close on 21 August qualify, with the shares trading ex-entitlement from 24 August. Payment is in two equal instalments, on 23 November and 21 December.

Did the results beat analyst expectations?

Yes, though the size of the beat depends on the survey. One compilation put consensus net income near R$45.5 billion, another near R$50.8 billion. Both had adjusted EBITDA within a few percent of the reported figure, so the surprise was wider at the profit line than at the operating line.

Why was reported profit lower than the adjusted figure?

One-off events reduced reported net income by roughly R$3.4 billion in the quarter. That is the opposite of the first quarter of 2026, when one-off items lifted the reported figure well above the recurring one. Comparing recurring numbers across quarters gives a more consistent picture than comparing headline profit.

Sources

Agência Petrobras · Petrobras Investor Relations · SEC Form 6-K

Connected Coverage

Brazil: Energy & Markets

Petrobras Hits Record Oil Output Ahead of Q2 Results

More Brazil coverage from The Rio Times

Sources: Agência Petrobras, Petrobras Investor Relations, SEC Form 6-K, Bloomberg consensus via Seu Dinheiro.

This article was produced by The Rio Times’ automated newsroom system. How we use AI · Report an error

LatAm Markets: Live Signals → — real-time movers, turnover leaders and FX across Latin America.

Read More from The Rio Times

Daily Brief

The morning intel from across Latin America. Free.

By subscribing you agree to our privacy policy. We never share your email.

Rotate for Best Experience

This report is optimized for landscape viewing. Rotate your phone for the full experience.