
PANAMA · CANAL
Key Facts
- The country Panama is the Central American nation that runs the Panama Canal, the shortcut between the Atlantic and Pacific oceans, led by President José Raúl Mulino.
- What happened Panama Canal revenue reached US$6.6 billion in the year to 30 September 2026, up 16.6%, in preliminary figures out on 21 October.
- The traffic Ships made 13,951 crossings, up 4.1% from 13,404, and carried 521 million tons of cargo measured in the canal’s own units, up 6.5%.
- The drivers The authority credits energy cargo, container ships and larger vessels, with the biggest locks now handling 52.2% of all tonnage.
- The catch The revenue figure is unaudited, and the authority has not published a breakdown of tolls, auction fees and other income.
- Prediction markets Polymarket gives 2.9% to the US taking the Panama Canal before 2027 (22 October, 10:37 a.m. ET).
- Power Index Panama ranks 11th of 14 in The Rio Times Latin America Power Index, with 34.2 points (October 2026 edition).
Panama Canal revenue reached US$6.6 billion in the fiscal year to 30 September 2026, up 16.6%, according to the Panama Canal Authority. The state agency that runs the waterway published the preliminary results on Wednesday 21 October 2026.
For US readers the number shows how busy the route is for American fuel, containers and consumer goods heading to and from Asia. It follows the news that last-minute crossings returned at the older locks on the same day.
The Panama Canal Revenue Figures
The canal authority says Panama Canal revenue grew 16.6% to US$6.6 billion, a figure that has not yet been audited. The agency counts its income in balboas, which Panama pegs one to one with the US dollar.
Ships made 13,951 crossings in the 12 months from October 2025, up 4.1% from 13,404 the year before. That works out to about 38 crossings a day.
More Cargo From Bigger Ships
Cargo grew faster than ship numbers. The canal moved 521 million PC/UMS tons, up 6.5% from 489.2 million, using its own measure of a ship’s internal volume.
The Neopanamax locks, the wide channel opened in 2016 for the largest ships, handled 52.2% of all tonnage, and tonnage there rose 8.2%. The authority links that rise to a growing share of bigger vessels.
The results statement says the gains came mainly from energy shipping and strong container ship traffic. It adds that the trend reflects a sustained recovery in demand, helped in part by shifts in international trade flows.
Water Held Up Through the Dry Season
The canal kept a maximum draft of 50 feet through the dry season, the depth that lets the biggest ships cross fully loaded. In July the authority said an El Niño weather pattern was likely and that capacity limits were probable.
Its results statement now says water-saving measures worked and recent rain in the watershed is close to average. The same day it brought back last-minute crossings for ships without a booking at the older Panamax locks.
Who Presented the Results
Administrator Ilya Espino de Marotta, who took charge in September, presented the results on a call hosted by Bank of America Merrill Lynch. Deputy Administrator Miguel Lorenzo and finance vice president Juan Mojica joined her.
Espino de Marotta said that far from restricting trade flows, the canal facilitates international maritime trade. The authority also tied the year to its Vision 2025-2035 plan, which includes the Río Indio reservoir project.
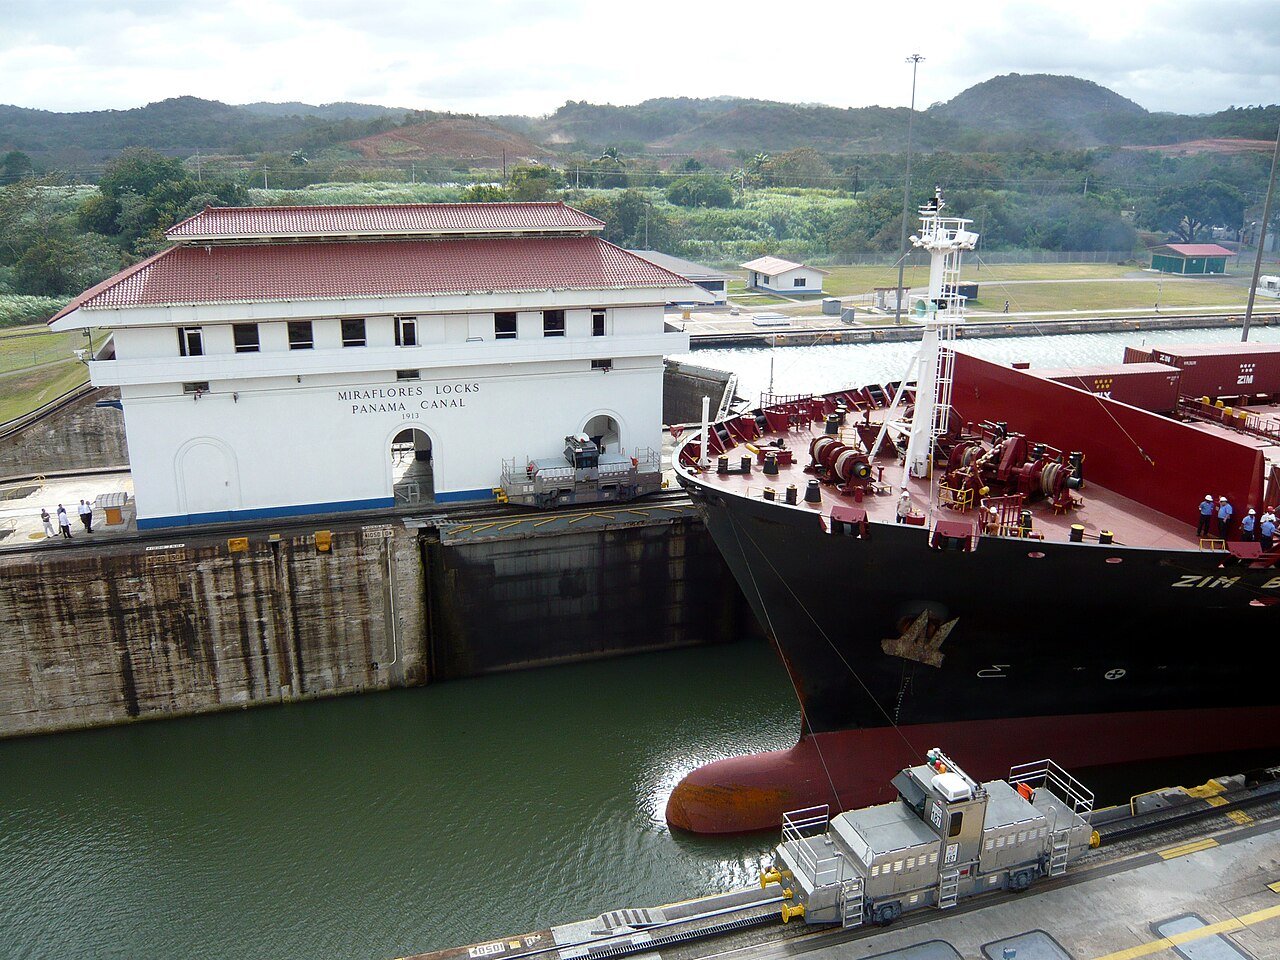
Why Panama Canal Revenue Rose So Fast
The authority has not itemized the US$6.6 billion, so the split between tolls, slot auction fees and other income is not public. In April it said average auction prices rose from US$135,000-140,000 to about US$385,000 after the Middle East conflict began.
Our earlier report on the Hormuz effect on canal income explains how disruption in the Middle East pushed more ships toward the canal. The authority’s own results statement names energy and container cargo as the drivers.
What Prediction Markets Say
On Polymarket, an online prediction market, traders give 2.9% to the United States taking the Panama Canal before 2027 (22 October, 10:37 a.m. ET). Traders are betting on politics, not on toll income.
Treat the price as a gauge of sentiment, not a poll. It says nothing about canal traffic or revenue.
Why we show this: prediction markets turn real-money bets into a live probability that moves within minutes of the news, which is why investors, campaigns and newsrooms in the United States now follow them closely. We show them next to polls and official results, never instead of them.
What It Means for US Readers
The canal is a main route for goods between Asia and ports on the US East and Gulf coasts. Steady transits and a full 50-foot draft help keep freight schedules for American importers and exporters predictable.
Exporters of US energy and farm goods also use the waterway to reach Asian buyers. Higher Panama Canal revenue also shows how much cargo now depends on this single passage.
What Is Not Known
The audited revenue figure and the split between tolls, auction fees and other income have not been published. The authority has not said what the unaudited number means for the payment it sends to Panama’s treasury.
It is not yet clear how El Niño will affect water levels in the coming dry season. The authority says it will keep watching water and rainfall, which drive Panama Canal revenue.
More: Panama news in English, every day from The Rio Times.
Frequently Asked Questions
How much was Panama Canal revenue in fiscal 2026?
Panama Canal revenue was US$6.6 billion in the year to 30 September 2026, up 16.6%. The figure is preliminary and has not been audited.
How many ships crossed the canal?
The canal recorded 13,951 transits, up 4.1% from 13,404 in the previous year. Cargo reached 521 million PC/UMS tons, up 6.5%.
What drove the growth?
The canal authority points to energy cargo, container ships and a rising share of larger vessels. The Neopanamax locks handled 52.2% of all tonnage.
What is a Neopanamax lock?
It is the wider set of locks opened in 2016 for the largest container ships and gas carriers. The older Panamax locks, from 1914, take smaller ships.
Does this affect US shipping costs?
The report gives no toll changes, so no direct cost change is stated. Steady transits and full-depth crossings can help keep delivery times for US cargo predictable.
Sources: Panama Canal Authority, 21 October 2026; TVN Panamá, 21 October 2026; La Estrella de Panamá, 20 October 2026; Panama Canal Authority, 23 April 2026; Panama Canal Authority, 22 July 2026.
This article was produced by The Rio Times’ automated newsroom system. How we use AI · Report an error · Editorial responsibility: Matthias Camenzind, Editor-in-Chief