Wheat Fund Rises 1.7% as Soy, Corn Edge Up | Grains Wrap, Nov 17
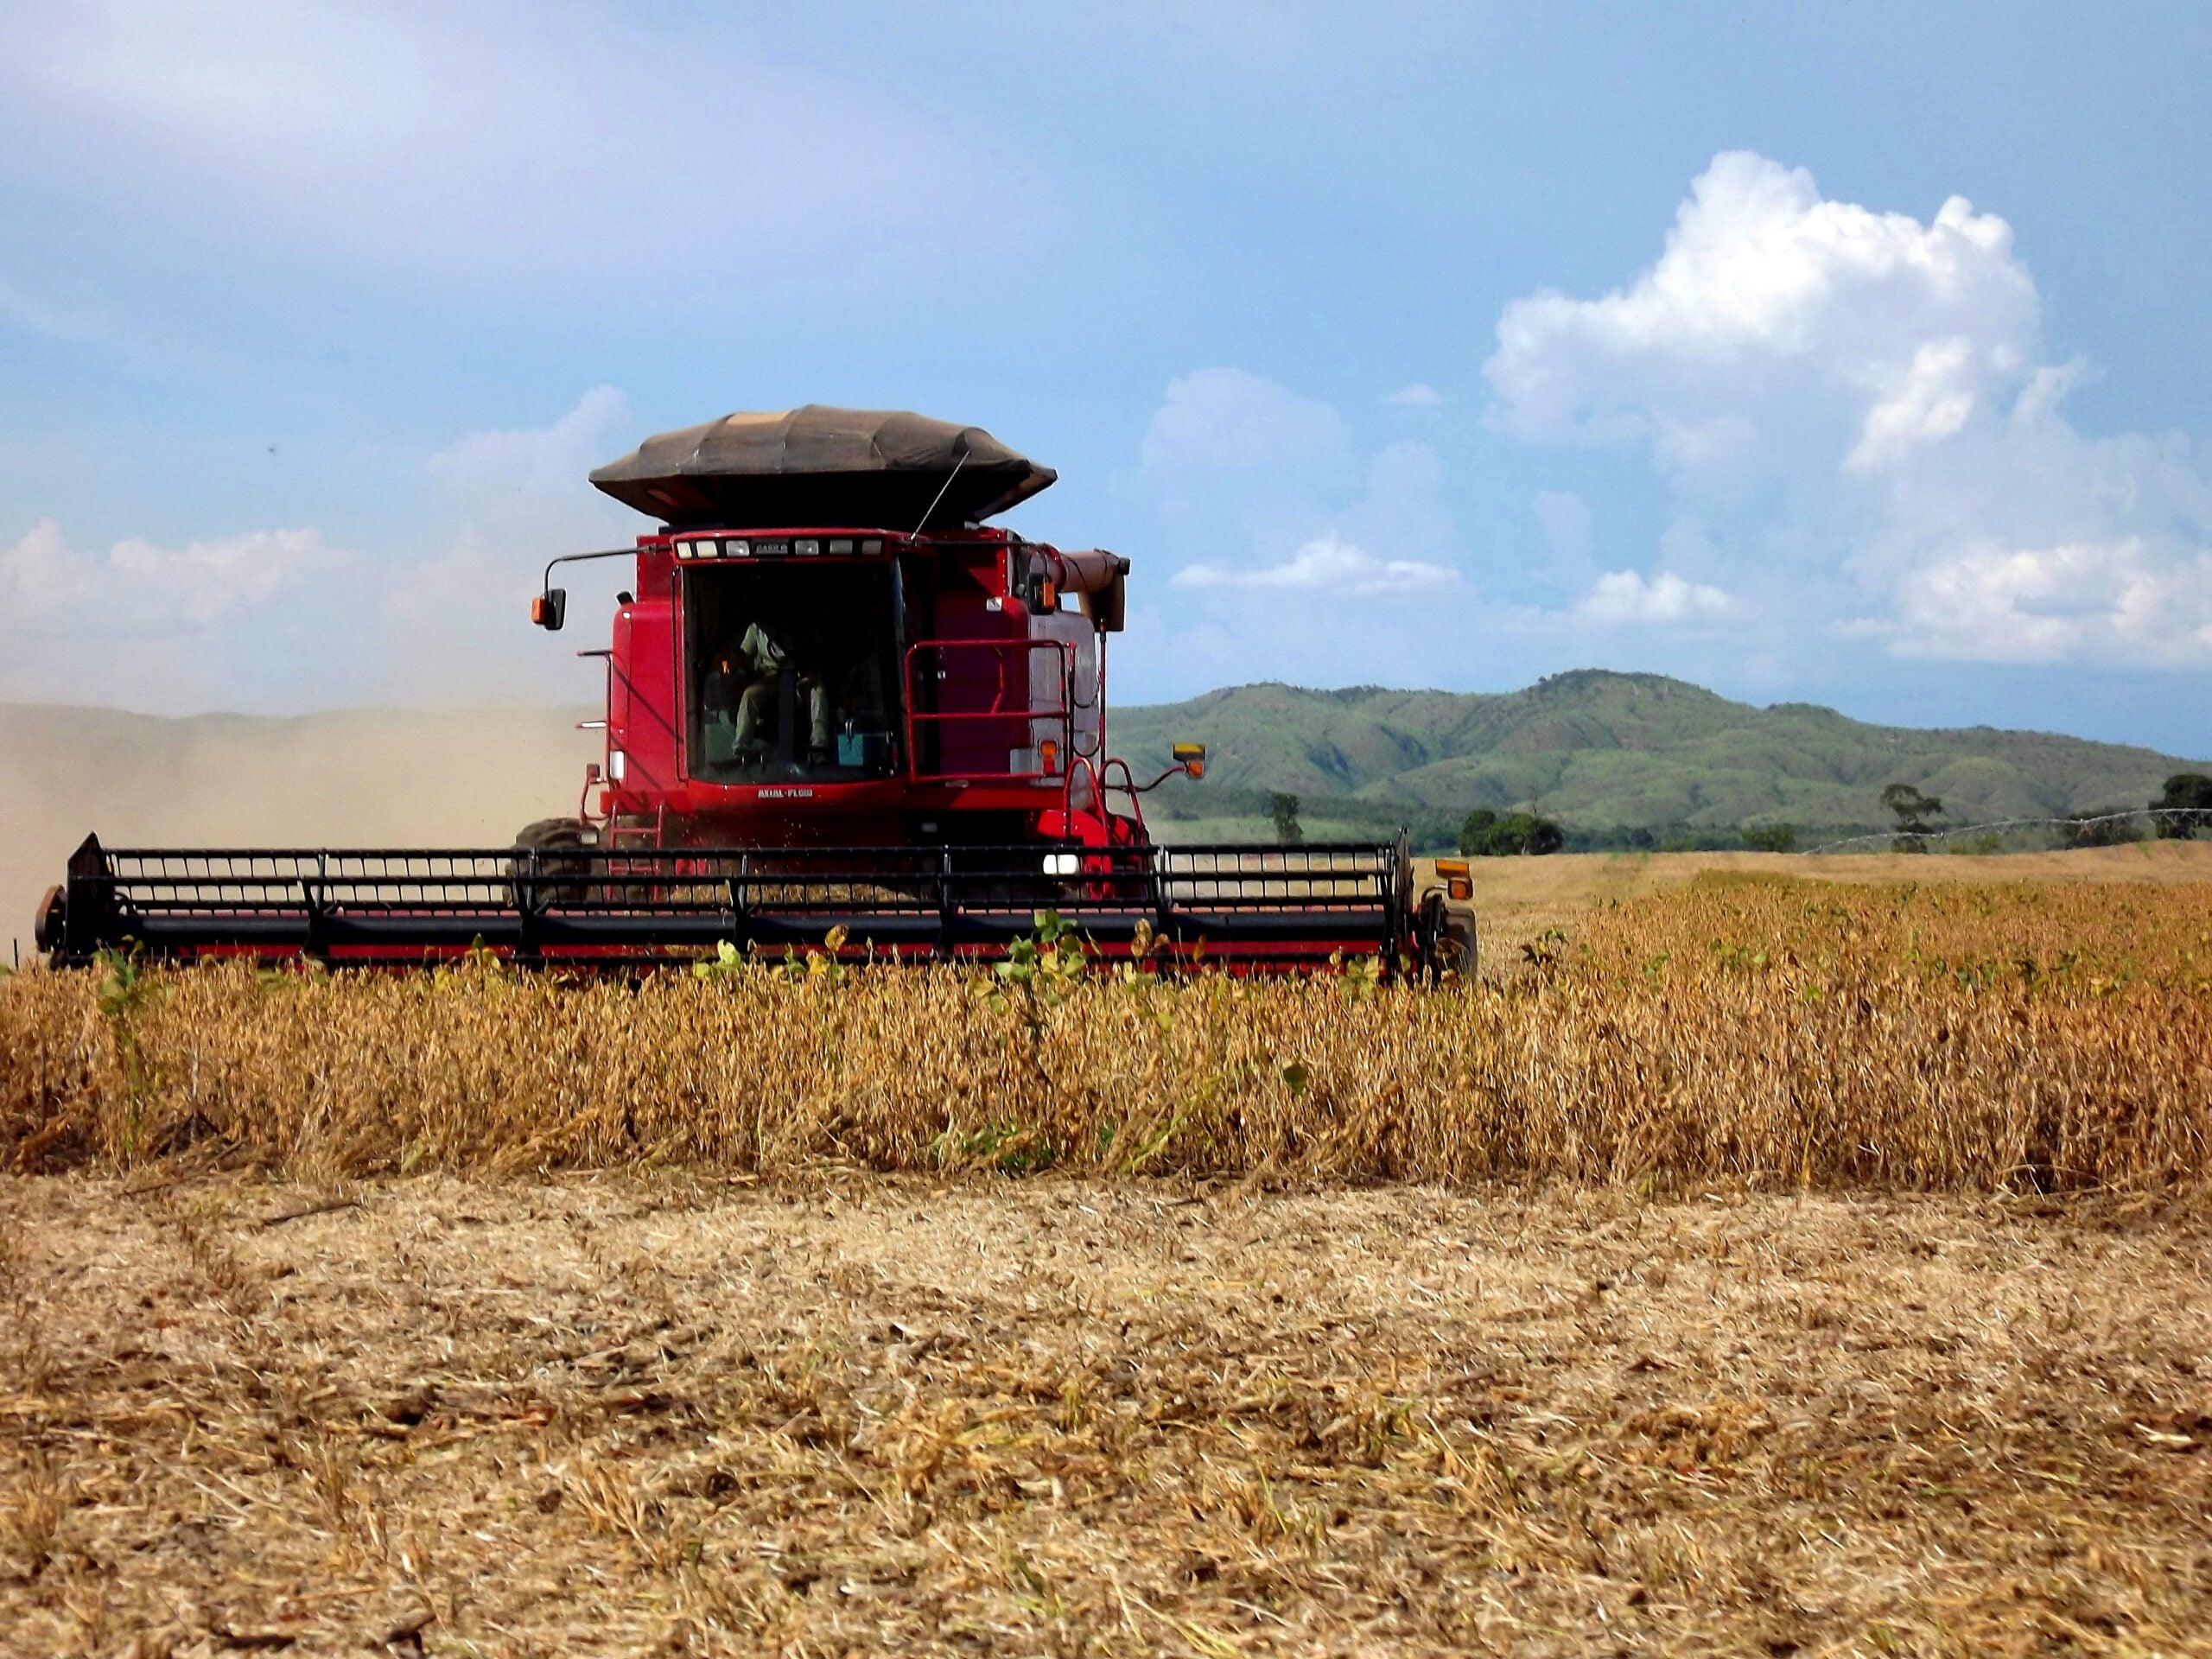
Key Facts
- Wheat: The WEAT fund, which tracks wheat futures, rose 1.67% to US$21.98; we could not confirm a trigger.
- Soybeans: The SOYB fund rose 0.39% to US$25.87, still 8.1% below its 10 September high.
- Corn: The CORN fund rose 0.29% to US$17.25, its third straight gain.
- Brazil: The national crop agency Conab puts Brazil’s 2026-27 soybean crop at about 181.6 million tonnes.
- Markets: The S&P 500 fell 1.03% and the VIX fear gauge jumped 11.13%.
Today’s Focus
Wheat did the heavy lifting on Tuesday, November 17, 2026. The wheat-tracking fund WEAT rose 1.67%, its best move of the three grains, though we could not confirm a single trigger.
Soybeans and corn rose only slightly. The soybean fund SOYB gained 0.39% and the corn fund CORN +0.29%, both small gains in a market that has been sliding for weeks.
The bigger picture is a harvest-driven slump. Soybeans are 3.11% lower over 20 sessions, corn 3.42% lower and wheat 6.67% lower, as Brazil’s planting season advances and supplies look ample.
What matters today. A one-day bounce in wheat does not change a market still dominated by plentiful supply and cautious Chinese buying.
01 The session in one read
On Tuesday, November 17, 2026, the wheat-tracking fund WEAT rose 1.67%, the best of the three grains.
Soybeans and corn were quieter, rising 0.39% and +0.29% respectively on the funds that track them. Those are small gains after weeks of drift lower.
The evidence points to a relief bounce rather than a new rally: all three grains remain well below their late-summer peaks, and the wheat gain came with fear rising elsewhere, not with fresh buying of grain itself. Brazil’s crop, which Conab estimates at about 181.6 million tonnes, is the supply that caps prices, so the variable to watch is Brazilian weather over the coming weeks.
02 The board
These are funds that track the grains, not the grains’ own prices. The soybean fund SOYB closed at US$25.87, the corn fund CORN at US$17.25 and the wheat fund WEAT at US$21.98.
Corn has now risen three sessions running, while soybeans and wheat each managed one. A streak that short is a pause, not a turn.
| Asset | Level | Change |
|---|---|---|
| Soybeans (SOYB) | US$25.87 | +0.39% |
| Corn (CORN) | US$17.25 | +0.29% |
| Wheat (WEAT) | US$21.98 | +1.67% |
Source: RT close, 2026-11-17. Where a commodity has no spot feed, an exchange-traded tracker or leading producer is shown as a labelled proxy.
Live Market IntelligenceThe live market board
Rio Times · Live Market Intelligence
Latin America — Cross-Market Board
| Instrument | Last | Change | YoY | Prev. | High | Low | Volume |
|---|---|---|---|---|---|---|---|
| IBOV | 169,816.64 | +0.31% | +8.17% | 169,295.41 | 171,750 | 169,300 | — |
| IPSA | 10,477.22 | -0.46% | — | 10,525.26 | 10,576 | 10,414 | — |
| IPC MEX | 71,365.93 | +0.23% | +13.56% | 71,204.98 | 71,447 | 70,307 | 172,011,187 |
| MERVAL | 2,848,945 | — | — | 2,848,945 | — | — | — |
| COLCAP | 2,452.46 | -0.02% | — | — | — | — | — |
| USD/BRL | 5.78 | -0.10% | +8.41% | 5.78 | 5.78 | 5.77 | — |
| EUR/BRL | 6.35 | +1.76% | +2.84% | 6.24 | 6.35 | 6.35 | — |
| USD/MXN | 18.42 | -0.50% | -0.04% | 18.52 | 18.43 | 18.40 | — |
| USD/CLP | 992.33 | -0.72% | +7.47% | 999.55 | 999.28 | 990.53 | — |
| USD/COP | 3,304 | -0.42% | -11.99% | 3,318 | 3,304 | 3,304 | — |
| USD/PEN | 3.41 | +0.05% | +1.52% | 3.41 | 3.45 | 3.41 | — |
| USD/ARS | 1,552 | +0.14% | +11.90% | 1,550 | 1,552 | 1,552 | — |
| USD/UYU | 40.61 | +3.40% | +3.45% | 39.27 | 40.61 | 40.26 | — |
| USD/PYG | 6,212 | +3.22% | -10.33% | 6,018 | 6,212 | 6,031 | — |
| USD/BOB | 11.64 | +2.89% | +72.14% | 11.31 | 12.00 | 11.64 | — |
| USD/DOP | 60.27 | +1.93% | -5.09% | 59.13 | 60.42 | 60.14 | — |
| USD/CRC | 441.73 | +1.57% | -9.63% | 434.89 | 450.45 | 441.73 | — |
| USD/GTQ | 7.64 | +3.17% | +1.99% | 7.41 | 7.64 | 7.64 | — |
03 Why it moved
The first cause, with low confidence, is positioning. After wheat fell 6.67% in 20 sessions, funds that had bet on further falls may have bought back, which lifts prices mechanically; we could not confirm a news trigger such as war risk to Black Sea shipping.
The signals conflict. The dollar index sat at 103.60 and is 1.34% higher over five sessions, a headwind for grains, because dollar-priced crops cost more for foreign buyers. The 10-year US Treasury yield stands at about 5.1%, up from about 4.8% in early November, which also raises the cost of holding stock.
The risk mood was poor: the S&P 500 fell 1.03% and the VIX fear gauge rose 11.13%. Grains rose against that backdrop, which supports the reading that this was a positioning move, not a demand story.
04 The trend behind it
Soybeans are 8.1% below their 12-month high of 10 September and 19.2% above their January low. Corn is 15.0% below its 1 September high and 4.7% above its June low, so it is much nearer the bottom of its range than the top.
Wheat is 21.5% below its 28 August high. This looks like a continuation of the post-summer decline, with Tuesday as a bounce within it.
Our own archive adds context. Since 2011, wheat has fallen at least this much over 20 sessions in 69 independent cases, and was higher 20 sessions later in 32 of them, or 46%. The median outcome was a 0.2% fall and the worst a 23.9% drop; history is not a forecast, but it says a deep fall does not guarantee a rebound.
05 What it means for Latin America
Brazil is the swing supplier. Conab puts its 2026-27 soybean crop at about 181.6 million tonnes. A big crop meets cautious buyers, which is why soybean prices struggle to rise.
China is the customer that matters. Conab names reduced Chinese demand and Argentina gaining export share among its pressures, which is a warning for Brazilian farmers.
For Argentina, a wheat bounce helps at the margin, since it is a major exporter. For importers such as Mexico and Peru, cheaper corn and wheat over recent months ease food and feed costs, though a renewed price rise would reverse some of that.
06 The names to watch
The three trackers are the clean read: SOYB for soybeans, CORN for corn and WEAT for wheat. Each follows futures, so they react to Chicago trading, not to the Brazilian cash market.
For Brazilian listed exposure, watch the farm-input and agribusiness shares that follow the crop and the real. A stronger dollar tends to help exporters’ reais earnings, but lower grain prices offset that.
07 What would end it
For wheat, the key levels are the 28 August high as resistance and Tuesday’s gain as the first support. A fall back through recent lows would say the bounce has faded.
For soybeans, the 10 September high is the ceiling, and the January low is the distant floor. For corn, the June low of 29 June is the floor to watch, only 4.7% below.
The next catalysts are Brazilian weather through the growing season, Chinese buying pace, and the next USDA monthly supply report in December. A drought in Brazil or a verified Chinese buying spree would end the slump; a benign harvest would extend it.
08 What to watch
- Black Sea risk: Any attack on ports or shipping lanes could lift wheat further.
- Brazilian weather: Rain or drought in Mato Grosso decides whether the 181.6 million tonne estimate holds.
- Chinese purchases: The pace of Chinese soybean buying is the swing factor for prices; slower buying would weigh on them.
- The dollar and yields: A dollar index at 103.60 and a 5.1% Treasury yield make dollar-priced grain costlier abroad.
Frequently Asked Questions
Why did wheat rise on Tuesday, November 17, 2026?
We could not confirm a single trigger; funds that had bet on falling prices may have bought back. The wheat-tracking fund WEAT rose 1.67%.
Are these prices the grains themselves?
No. SOYB, CORN and WEAT are funds that track soybeans, corn and wheat, so their prices follow the commodities but are not the commodity prices.
Why does Brazil matter so much for soybeans?
Brazil is the world’s largest soybean exporter, and Conab estimates its 2026-27 crop at about 181.6 million tonnes. A large crop caps global prices.
Is the slump over?
Not yet. Soybeans, corn and wheat are all lower over 20 sessions, and wheat is 21.5% below its August high.
Market data: The Rio Times
This article was produced by The Rio Times’ automated AI newsroom. Editorial responsibility: Matthias Camenzind, Publisher and Editor-in-Chief. The Rio Times also runs Ask Rio Times, which answers from 100,000+ of our own articles, the daily Latin America Power Map, and prediction-market odds on elections and markets.. How we use AI · Report an error
LatAm Markets: Live Signals → — real-time movers, turnover leaders and FX across Latin America.