Wheat Slides to Six-Month Low on Big US Harvest | Grains Wrap, Nov 9

Key Facts
- Wheat is the story: the wheat-tracking fund WEAT closed Monday, 9 November 2026, at its lowest in at least six months, 22.7% below its 28 August high of 28.00 and down for a third session running.
- Soybeans and corn slipped too: SOYB, the soybean-tracking fund, moved −0.40% and CORN, the corn-tracking fund, moved -0.17%, extending a month of steady losses.
- The main cause is supply: traders pointed to a large US harvest, with 74% of the corn crop in by 1 November, and cautious export demand.
- Brazil adds weight: the national crop agency CONAB forecasts a record 181.64 million tonnes of soybeans for 2026/27, so South American supply is coming.
- The next test is Tuesday: the US Department of Agriculture (USDA) publishes its monthly supply and demand report (WASDE) on Tuesday, 10 November.
- History is mildly kind to soybeans: after earlier falls this large, soybeans were higher 20 sessions later in 65% of cases, wheat in only 38%.
Today’s Focus
Wheat had a miserable Monday. The wheat-tracking fund WEAT closed at US$21.65 after a move of −0.37%, its third straight fall and its lowest close in at least six months.
Soybeans and corn drifted lower in sympathy, with SOYB at US$25.22 and CORN at US$17.16. The common cause is plentiful supply: a big US harvest is reaching market while buyers hold back.
For Latin America the pressure is double-edged. Brazil and Argentina sell grain to the world, so lower prices trim their export earnings, while Brazil’s own record soybean crop is adding to the glut.
What matters today. Grain prices are falling because supply is abundant, and today’s USDA report will show whether that abundance is being confirmed or trimmed.
01 The session in one read
Grains ended Monday, 9 November 2026, lower across the board. Wheat led the retreat, closing at its weakest in at least six months.
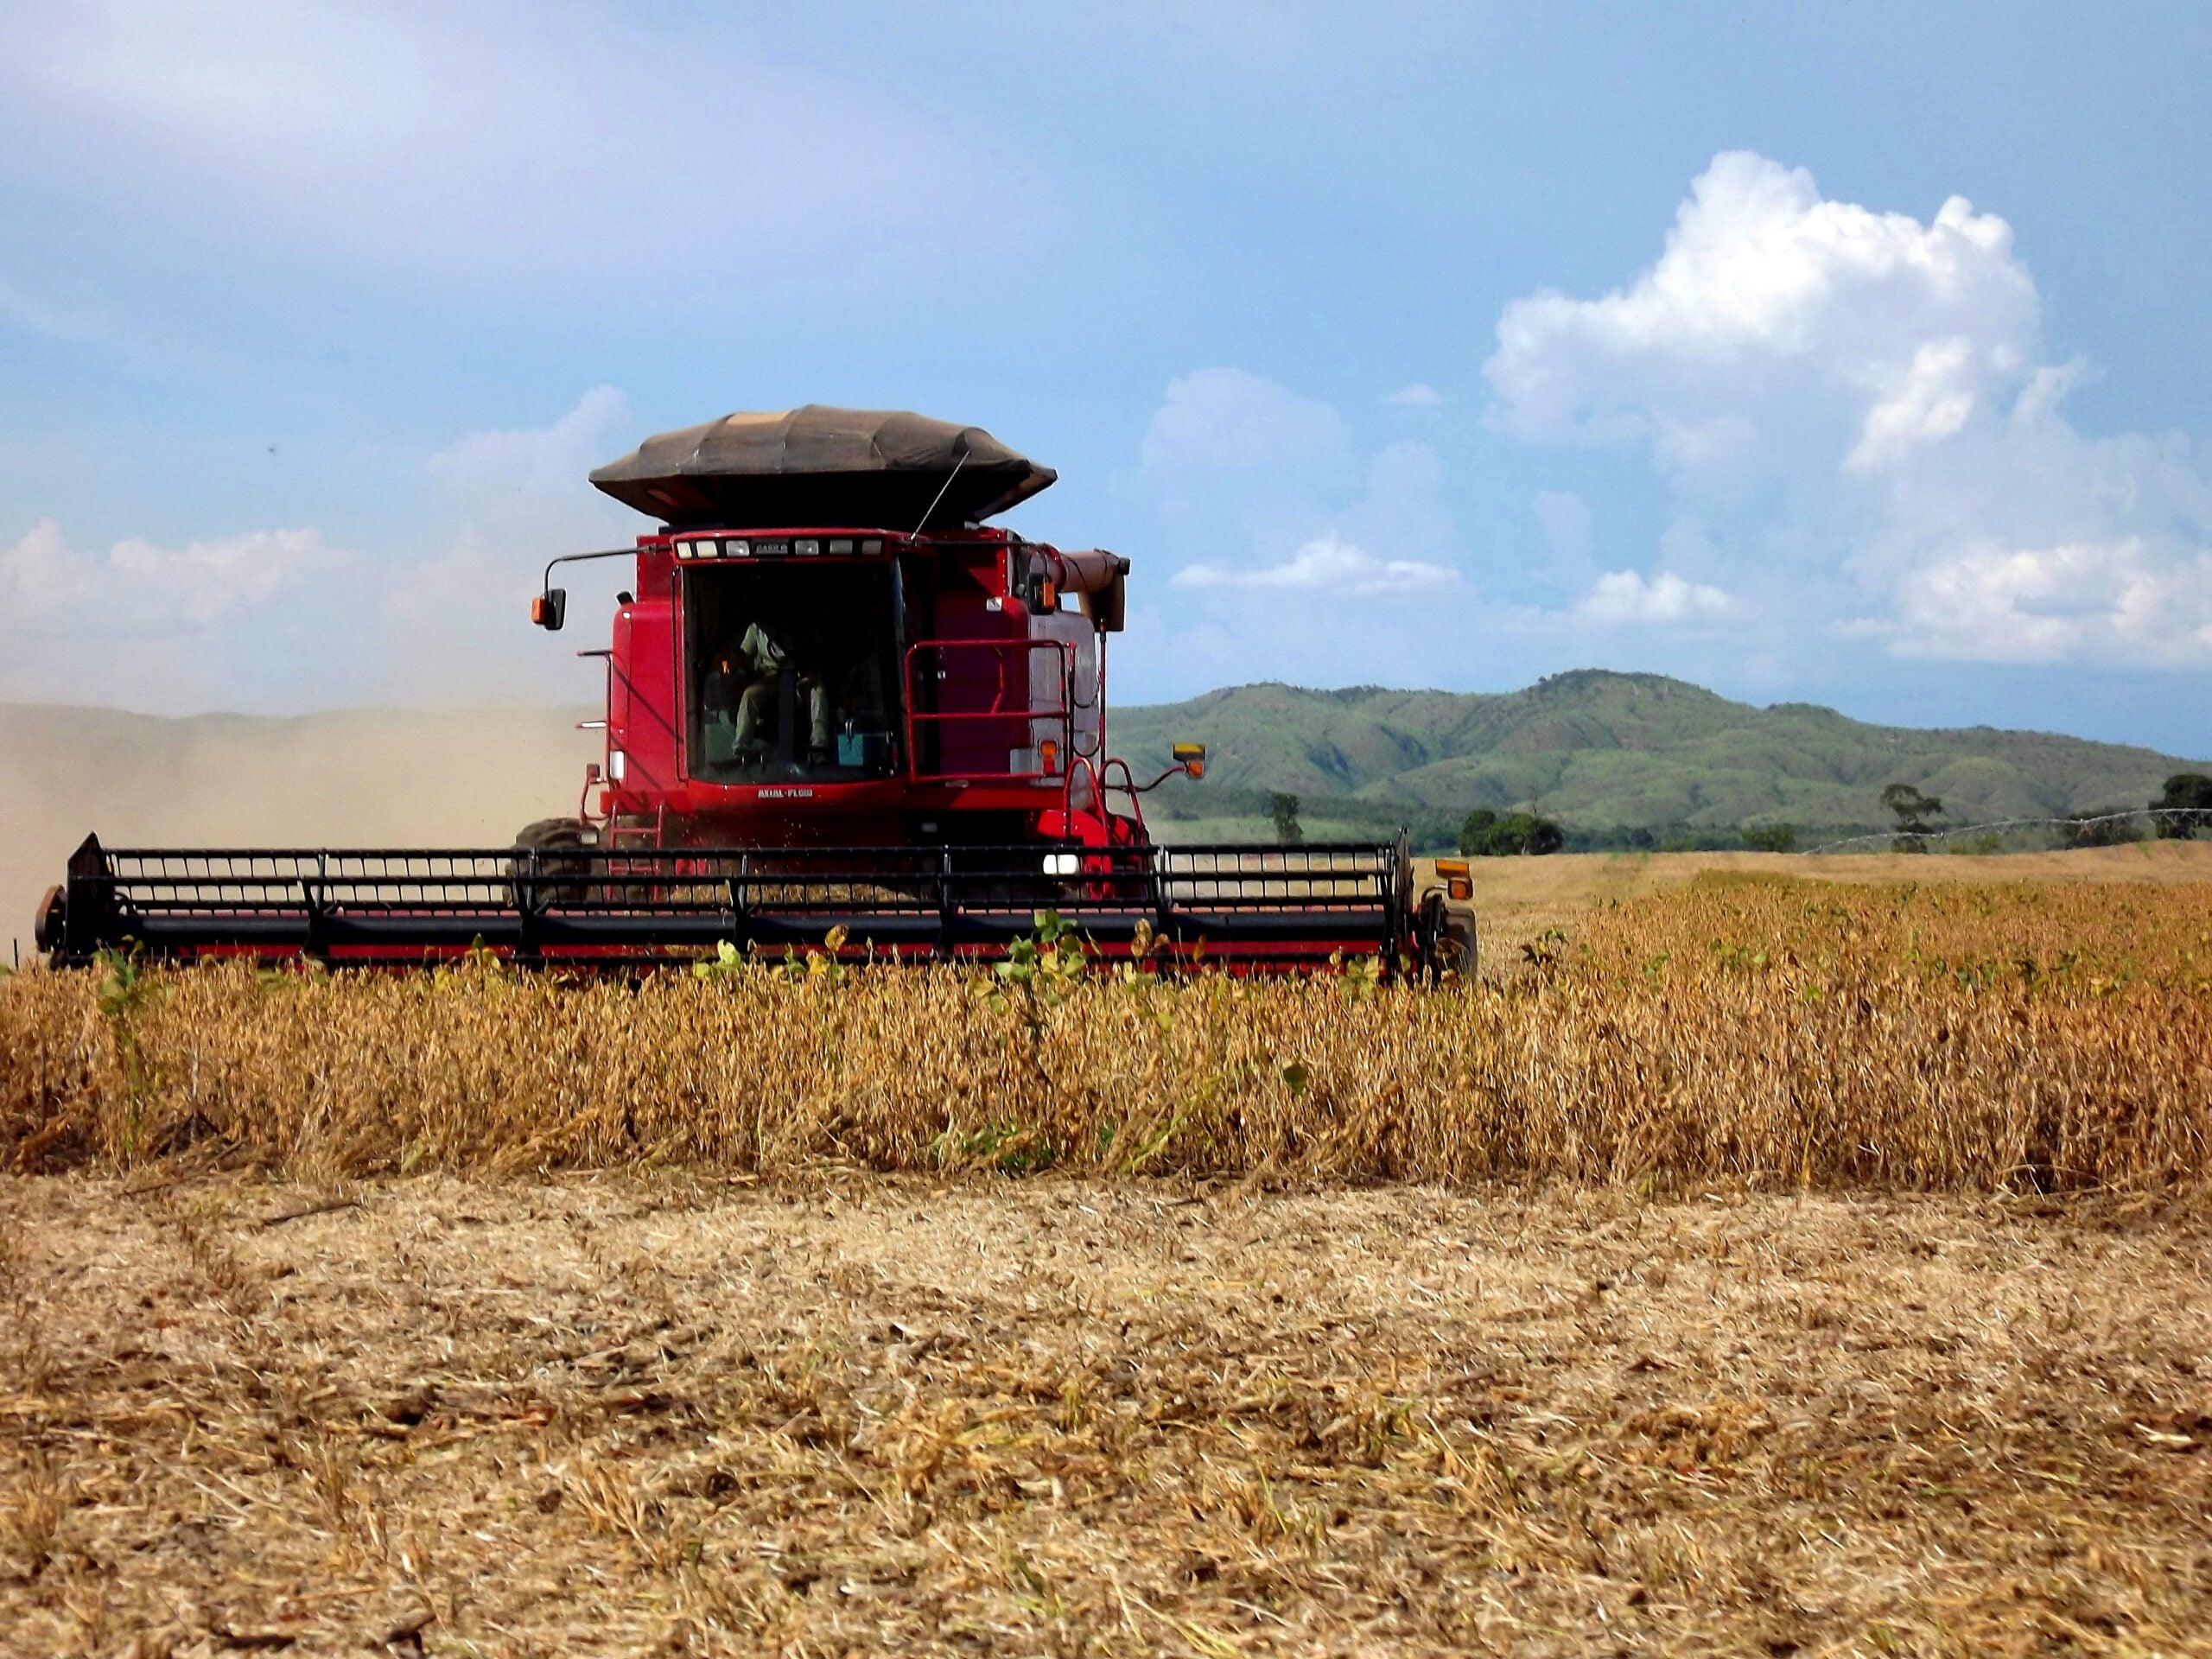
Think of the market as a warehouse filling faster than customers are collecting. Farmers in the northern hemisphere have nearly finished harvesting, and buyers see no need to rush.
The falls are orderly and tied to harvest pressure rather than a shock, which fits a market that is simply well stocked. Wheat looks the weakest of the three, and the variable to watch is whether today’s USDA report lifts its stock forecasts further.
02 The board
SOYB, the soybean-tracking fund, closed at US$25.22 (−0.40%). CORN, the corn-tracking fund, ended at US$17.16 (-0.17%), and WEAT at US$21.65 (−0.37%).
These funds follow futures contracts, so they are proxies and not the farm-gate price. Their direction, however, matches the grain markets they follow.
| Asset | Level | Change |
|---|---|---|
| Soybeans (SOYB) | US$25.22 | -0.40% |
| Corn (CORN) | US$17.16 | -0.17% |
| Wheat (WEAT) | US$21.65 | -0.37% |
Source: RT close, 2026-11-09. Where a commodity has no spot feed, an exchange-traded tracker or leading producer is shown as a labelled proxy.
Live Market IntelligenceThe live market board
Rio Times · Live Market Intelligence
Latin America — Cross-Market Board
| Instrument | Last | Change | YoY | Prev. | High | Low | Volume |
|---|---|---|---|---|---|---|---|
| IBOV | 172,236.05 | +2.22% | +10.94% | 168,498.45 | 172,236 | 168,498 | — |
| IPSA | 10,589.61 | +0.50% | — | 10,536.54 | 10,650 | 10,550 | — |
| IPC MEX | 72,104.80 | +1.00% | +13.89% | 71,393.57 | 72,227 | 71,366 | 180,043,849 |
| MERVAL | 2,848,945 | — | -10.97% | 2,859,051 | — | — | — |
| COLCAP | 2,576.36 | +3.67% | — | — | — | — | — |
| USD/BRL | 5.51 | +0.04% | +3.33% | 5.51 | 5.51 | 5.51 | — |
| EUR/BRL | 6.18 | +0.86% | +0.32% | 6.13 | 6.19 | 6.18 | — |
| USD/MXN | 18.53 | -0.51% | +0.50% | 18.63 | 18.56 | 18.51 | — |
| USD/CLP | 966.96 | -0.99% | +3.97% | 976.64 | 975.74 | 966.06 | — |
| USD/COP | 3,267 | +0.81% | -12.58% | 3,240 | 3,267 | 3,267 | — |
| USD/PEN | 3.41 | -1.07% | +3.19% | 3.44 | 3.41 | 3.41 | — |
| USD/ARS | 1,545 | -0.02% | +9.71% | 1,546 | 1,545 | 1,545 | — |
| USD/UYU | 40.45 | +0.35% | +3.06% | 40.31 | 40.45 | 40.45 | — |
| USD/PYG | 6,450 | +1.45% | -7.23% | 6,358 | 6,450 | 6,450 | — |
| USD/BOB | 11.74 | -0.59% | +74.26% | 11.81 | 11.74 | 11.74 | — |
| USD/DOP | 60.42 | -0.28% | -4.80% | 60.59 | 60.46 | 60.42 | — |
| USD/CRC | 446.56 | -0.38% | -8.72% | 448.27 | 446.56 | 446.56 | — |
| USD/GTQ | 7.64 | -0.05% | +2.13% | 7.64 | 7.64 | 7.64 | — |
03 Why it moved
Cause one, with high confidence, is harvest supply. Wire reports from earlier this month say wheat, corn and soybeans all fell on a large US harvest, and 74% of the US corn crop was gathered by 1 November.
Cause two, with medium confidence, is soft export demand. Traders were cautious about buying, especially from markets outside China, although CME Group noted in September that Chinese import demand continues to underpin prices.
Cause three, with medium confidence, is positioning before today’s USDA report. Analysts expected it to lift the US wheat ending-stocks forecast by 4 million bushels to 744 million, and traders tend to sell ahead of bearish news.
The usual outside drivers were mixed and explain little. The US dollar index eased 0.61% to 101.68, which normally helps US grain sales abroad, yet prices still fell; the 10-year Treasury yield rose 3 basis points to 4.89%; and the S&P 500 jumped 2.35% as the VIX fear gauge dropped 22.31%.
Oil, tracked by the USO fund, fell 3.87%, which lowers costs for farmers and for ethanol makers who buy corn. Gold, tracked by GLD, rose 1.88%, so money was not fleeing risk; it simply did not want grain.
04 The trend behind it
This is a continuation, not a new phase. Soybeans are 8.19% lower over 20 sessions and 10.4% below their 10 September high of 28.14, though still 16.2% above the January low of 21.71.
Corn has lost 7.04% in 20 sessions and sits 15.4% below its 1 September high of 20.29, only 4.2% above its 29 June low of 16.47. Wheat has fallen 11.49% in 20 sessions and 13.3% in 60.
The turn came in late summer. CME Group reported soybean futures at a three-year high on 1 and 2 September on strong export demand, and every grain has drifted lower since.
Our own archive adds a measure of perspective. After earlier falls as large as soybeans’ 8.19%, the fund was higher 20 sessions later in 15 of 23 cases (65%), with a median of +1.1% and a worst case of -6.0%.
Corn is a coin toss: after 50 earlier falls like this one, it was higher in 24 cases (48%), median -0.7%, worst -12.5%. Wheat is the weak link, higher in only 8 of 21 cases (38%) with a worst case of -25.3%. History is not a forecast.
05 What it means for Latin America
Brazil is both seller and cause. CONAB expects a record 181.64 million tonnes of soybeans in 2026/27 from 49.3 million hectares, and the private forecaster AgRural sees 182.7 million tonnes, so supply is rising just as prices sag.
Lower prices squeeze the export earnings and farm incomes of Brazil and Argentina, which feed the real and peso economies through dollar receipts. The Brazilian exporters’ association ANEC expects 6.02 million tonnes of corn shipments in November, so volume holds up even as the price per tonne softens.
Importers gain. Wheat-buying countries across the region, including Mexico, Peru and Colombia, benefit from cheaper cargoes and lower bread and feed costs.
CONAB flags El Niño, a Pacific weather pattern, as a risk to yields, which it expects to fall about 0.8%. That is the main Latin American wildcard for prices.
06 The names to watch
The three trackers are the cleanest gauges: WEAT for wheat, SOYB for soybeans, CORN for corn. Wheat is closest to a breakdown, with its 22.7% drop from the August high the largest of the three.
Beyond them, watch the Brazilian crop agency CONAB, the exporters’ association ANEC, the private forecaster AgRural and the USDA. Their numbers set the tone for supply.
07 What would end it
The nearest hurdle for soybeans is the 21.71 January low, and for corn the 16.47 June low, now only 4.2% below the market. For wheat, the high of 28.00 is distant, so the next test is simply whether the six-month low holds.
The next dated event is the USDA WASDE report on Tuesday, 10 November. A cut to crop or stock estimates would calm the slide; a rise, as analysts expected for wheat, would deepen it.
Beyond that, Brazilian planting weather and Chinese buying decide the winter. The honest answer is that the slide may pause on a bullish report, but a lasting reversal needs demand to pick up.
08 What to watch
- USDA report: The WASDE release on 10 November, especially US wheat ending stocks against the expected 744 million bushels.
- Brazil crop: CONAB updates and El Niño weather for the record 181.64 million tonne soybean forecast.
- China demand: Whether Chinese buyers book US and Brazilian cargoes or leave the market quiet.
- Corn floor: Whether CORN holds above its 16.47 June low, now 4.2% away.
Frequently Asked Questions
Why did grain prices fall on Monday?
A large US harvest, cautious export demand and positioning before the USDA report weighed on all three grains, with wheat at a six-month low.
Does cheaper grain hurt Brazil?
Yes for farm incomes and export earnings, though Brazil’s record soybean crop of 181.64 million tonnes is forecast, so volumes stay large.
Is SOYB the soybean price?
No. SOYB is a fund that tracks soybean futures, so it is a proxy and not the commodity’s own price.
Will the fall continue?
History offers no promise: soybeans rose after earlier similar falls in 65% of cases, wheat in only 38%.
Market data: The Rio Times
This article was produced by The Rio Times’ automated AI newsroom. Editorial responsibility: Matthias Camenzind, Publisher and Editor-in-Chief. The Rio Times also runs Ask Rio Times, which answers from 100,000+ of our own articles, the daily Latin America Power Map, and prediction-market odds on elections and markets.. How we use AI · Report an error
LatAm Markets: Live Signals → — real-time movers, turnover leaders and FX across Latin America.