Global Goods Trade Hits US$13.7 Trillion on Higher Prices
Global · TRADE
Key Facts
—Half-year record: Global goods trade hit US$13.7 trillion in H1 2026, up 12.5%; UNCTAD cites higher prices.
—Annual milestone: Global trade hit US$35 trillion in 2025; goods added US$1.8 trillion of US$2.5 trillion rise.
—Growth drivers: Q1 2026 saw critical minerals +38%, semiconductors +25%, batteries +15%, EVs +11%; solar/wind contracted.
—Africa’s share: Africa held 2.8% of world trade in 2025, down from 5% in 1994; 46 LDCs hold 1%.
—Value capture gap: Africa ships raw minerals; accounts for under 2% of world manufacturing value added.
—Trade governance: Export controls on chips, carbon border measures and local-content rules are reshaping trade flows.
Global goods trade reached about US$13.7 trillion in the first half of 2026, up 12.5% on a year earlier. UN Trade and Development says higher prices drove much of that rise.
Africa and Latin America still capture little of the value.
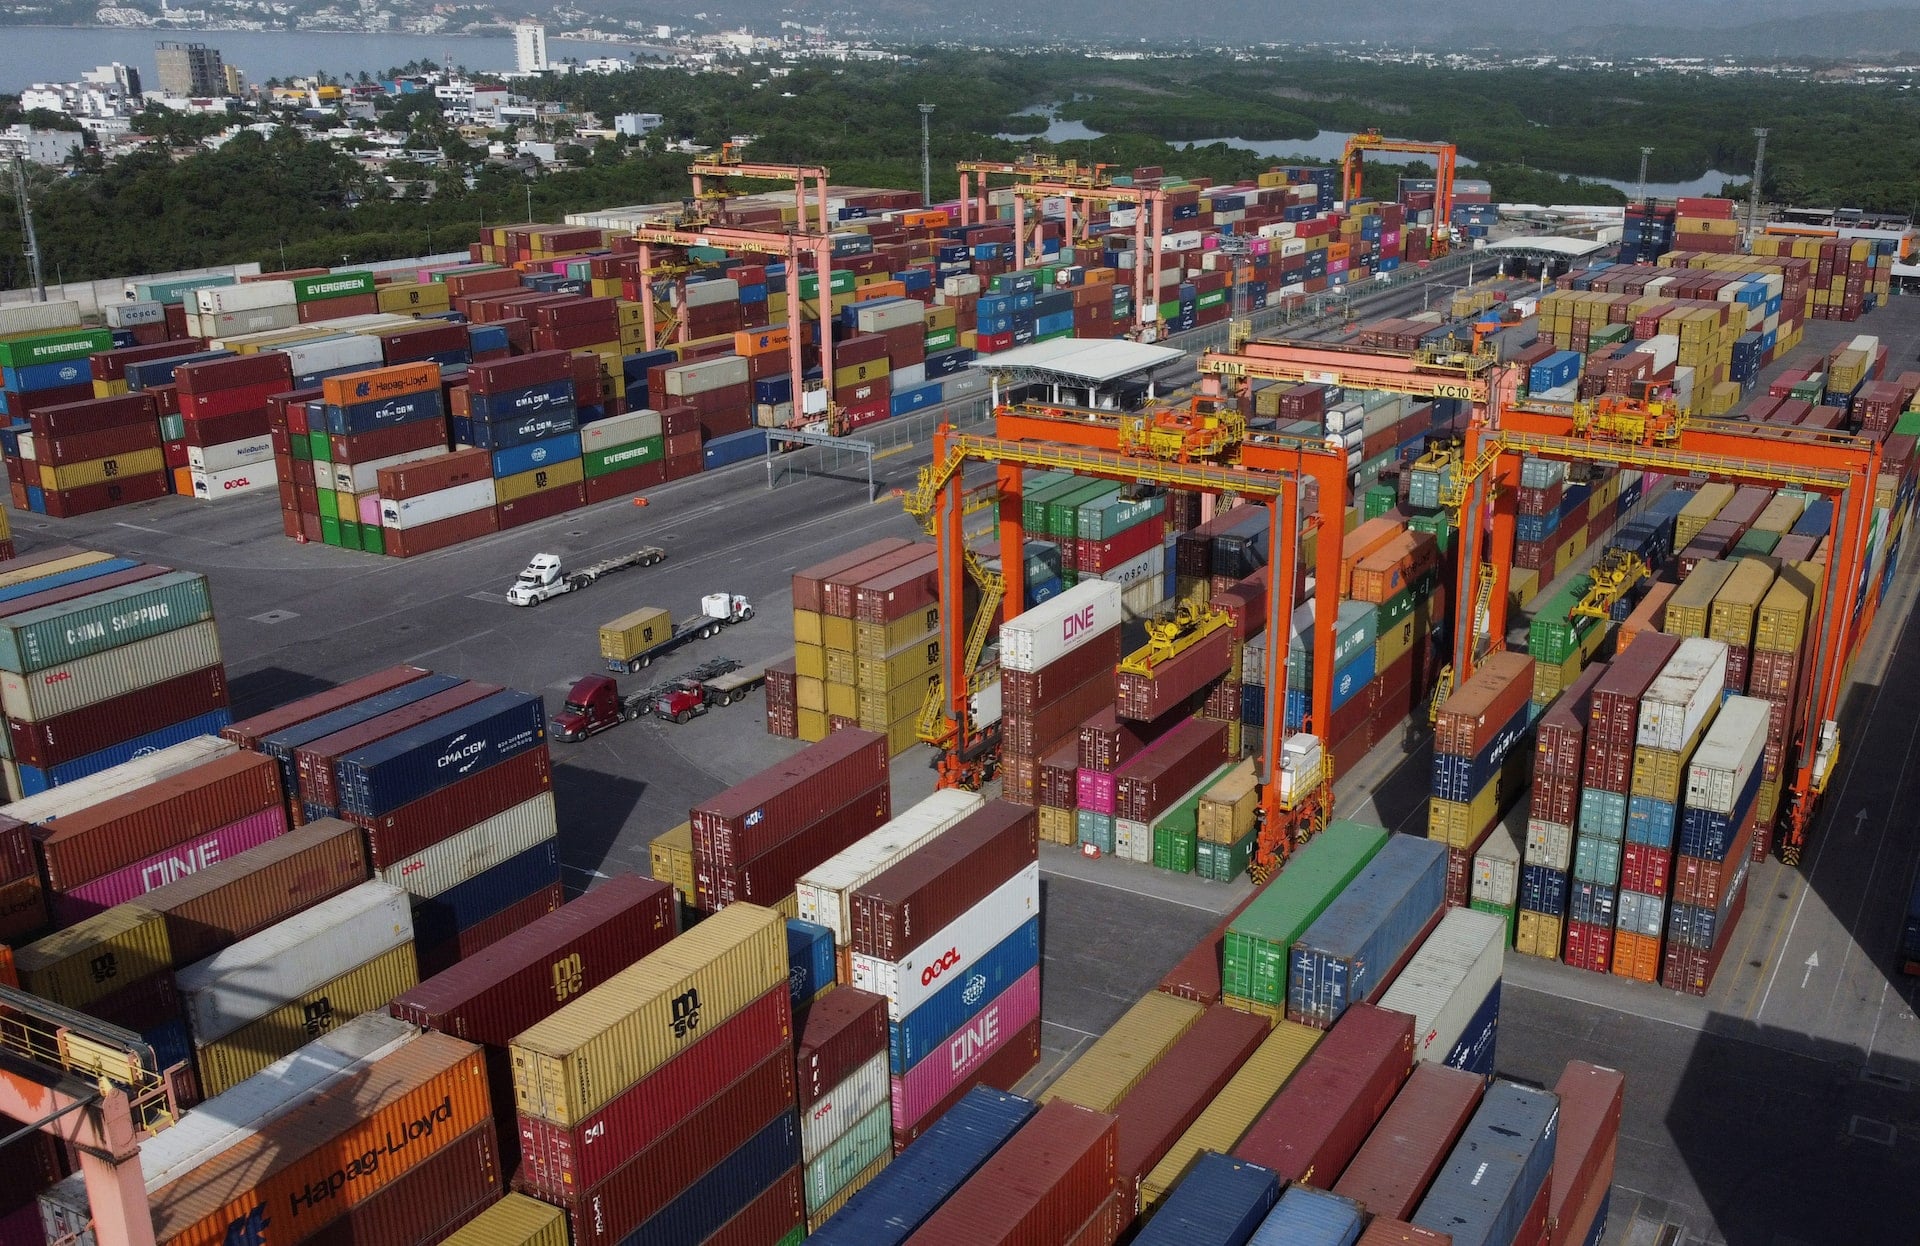
The US$13.7 trillion surge in global goods trade
The UN Conference on Trade and Development (UNCTAD) estimates global goods trade reached about US$13.7 trillion in the first half of 2026. The second-quarter share is a UNCTAD nowcast, not final data.
UNCTAD’s April 2026 update says goods trade added about US$1.8 trillion to global trade in 2025. Goods grew about 7% and services about 8%, adding roughly US$700 billion.
AI hardware and electric vehicles drive the boom
UNCTAD says the upswing is led by technology and energy-transition goods. Trade in semiconductors, data centre equipment and advanced computing hardware is rising strongly.
Critical minerals trade rose 38% in the first quarter of 2026, semiconductors 25%, batteries 15% and electric cars 11%. Solar and wind products contracted, and motor vehicle trade grew below average.
The Democratic Republic of Congo mined about 230,000 of the world’s 310,000 tonnes of cobalt in 2025. South Africa mined roughly 71% of the world’s platinum, and Zimbabwe is Africa’s largest lithium producer.
Africa’s tiny share of a huge trade pie
Africa’s measured share of global trade remains very small. The World Trade Report 2024 finds the 46 least developed countries account for just 1% of world trade.
That share has been flat since 1995. Africa matters to supply chains but earns little of the value, because most exports leave as raw material.
Most critical minerals leave the continent as unprocessed ore. Refining, cell making and vehicle assembly happen in China, the European Union, the United States, Japan and South Korea.
Who gains: the United States, China and the European Union
UNCTAD’s December 2025 update says China remained the world’s top exporter over the previous 12 months. In the first quarter of 2026, China’s imports rose 13%, the strongest of any major economy.
Chip design, cloud platforms and software are dominated by United States firms. Manufacturing sits in East Asia, above all Taiwan, South Korea and mainland China.
China leads in refining, cathode and anode materials, cell production and assembly. The European Union and the United States still rely on minerals imported from Africa and Latin America.
Latin America sits on the same fault line
Latin America barely features in the headline numbers, but it holds the minerals behind them. Chile mined 5.3 million tonnes of copper in 2025 and Peru 2.7 million.
Together that is about a third of world copper output, against 3.2 million tonnes from the Democratic Republic of Congo. Chile and Argentina mined 27% of the world’s lithium.
Argentina, Bolivia and Chile hold roughly 64 million of about 150 million tonnes of identified world lithium resources. China refines nearly half the world’s copper.
The region also felt the price story from the other side. UNCTAD says trade in coffee, tea and spices fell sharply as coffee prices dropped from earlier highs.
Intra-regional trade grew almost everywhere but stayed weak in South America. Even so, the World Trade Organization expects South American merchandise exports to grow 3.5% in 2026, level with Asia.
Trade rules, industrial policy and what to watch next
World merchandise trade volume grew 4.6% in 2025, the World Trade Organization says. Its March 2026 baseline sees growth slowing to 1.9% this year.
Export controls on chips, carbon border measures and local-content rules are reshaping trade flows. They decide which countries reach the highest-value parts of these supply chains.
The question for both regions is whether resource importance converts into negotiating power. Countries that have not built processing capacity are the most exposed to a shift in battery or chip design.
Frequently Asked Questions
How much did global goods trade reach in the first half of 2026?
Global goods trade reached about US$13.7 trillion in the first half of 2026, according to UNCTAD. That was an increase of 12.5% compared with the same period in 2025.
What is driving the surge in global goods trade?
Demand for artificial intelligence goods, semiconductors, batteries, critical minerals and electric vehicles is driving the boom. UNCTAD says higher prices for energy and freight also lifted trade values.
What share of world trade does Africa account for?
Africa’s share of world merchandise trade was 2.8% in 2025, down from 5% in 1994, the UN Economic Commission for Africa says. The 46 least developed countries hold about 1%.
Connected Coverage
For deeper analysis of how great-power competition is reshaping Africa’s resource politics, read our pillar Africa: The New Scramble.
Sources
This article was produced by The Rio Times’ automated newsroom system. How we use AI · Report an error
LatAm Markets: Live Signals → — real-time movers, turnover leaders and FX across Latin America.
Read More from The Rio Times