
COLOMBIA · TRADE
Key Facts
- The country Colombia is a South American country of more than 50 million people that exports oil, coal, coffee and gold.
- What happened The Colombia trade deficit for August 2026 came in at US$2.77 billion on Wednesday 21 October, up from US$1.65 billion a year earlier.
- Exports Sales abroad rose 15.1% to US$4.46 billion, lifted by gold and oil and held back by a 23.5% drop in coffee.
- Imports Purchases from abroad rose 31.7% to US$7.70 billion including freight and insurance, with fuel imports almost tripling.
- The US link Colombian imports from the United States rose 48.8% to US$1.74 billion, led by gasoline, diesel and corn.
- Power Index Colombia ranks 6th of 14 in The Rio Times Latin America Power Index, with 51.9 points (October 2026 edition).
The Colombia trade deficit hit US$2.77 billion in August 2026, as imports of fuel and corn from the United States surged and coffee exports fell. DANE, the national statistics agency, published the figure on Wednesday 21 October 2026.
For US readers it matters because American gasoline, diesel and corn were among the biggest drivers of the jump in Colombian imports. The United States is also still Colombia’s top export market, taking 27.2% of its sales abroad in August.
The Colombia Trade Deficit in August
Colombia sold US$4.46 billion of goods abroad in August, up 15.1% from a year earlier. Imports reached US$7.70 billion including freight and insurance, up 31.7%, or US$7.23 billion at the border price used to calculate the deficit.
The Colombia trade deficit of US$2.77 billion is about 68% wider than the US$1.65 billion recorded in August 2025. Market forecasts had pointed to a deficit of about US$2.8 billion, so the result was close to expectations.
July’s gap was US$2.87 billion in the agency’s latest series, so August was slightly smaller than the month before. Over January to August the deficit reached US$13.88 billion, already about 85% of the whole 2025 gap of US$16.38 billion.
Why Imports Behind the Deficit Jumped
Fuel imports rose 190.1% to US$1.18 billion, the sharpest rise of any group, and purchases of refined products such as gasoline and diesel climbed 262.6%. Fuels made up 15.3% of everything Colombia imported in August.
Manufactured goods still make up the largest share at 70.6%, or US$5.44 billion, up 18.9%. Machinery and transport equipment rose 22.8% and chemicals rose 22.2%, while food and farm products rose 24.8% to US$1.06 billion.
What Colombia Bought From the United States
Imports from the United States jumped 48.8% to US$1.74 billion, which gave American sellers 22.5% of the market. Gasoline imports from the US rose from US$118.9 million to US$424.3 million, and diesel-type gas oils rose from US$20.1 million to US$142.1 million.
American corn sales rose 50.5% to US$186.8 million, and Colombia also bought US$46.5 million of US crude oil after buying none a year earlier. China remained the top supplier with US$2.18 billion, or 28.3% of imports, and Chinese car sales to Colombia rose 157.2% to US$184.8 million.
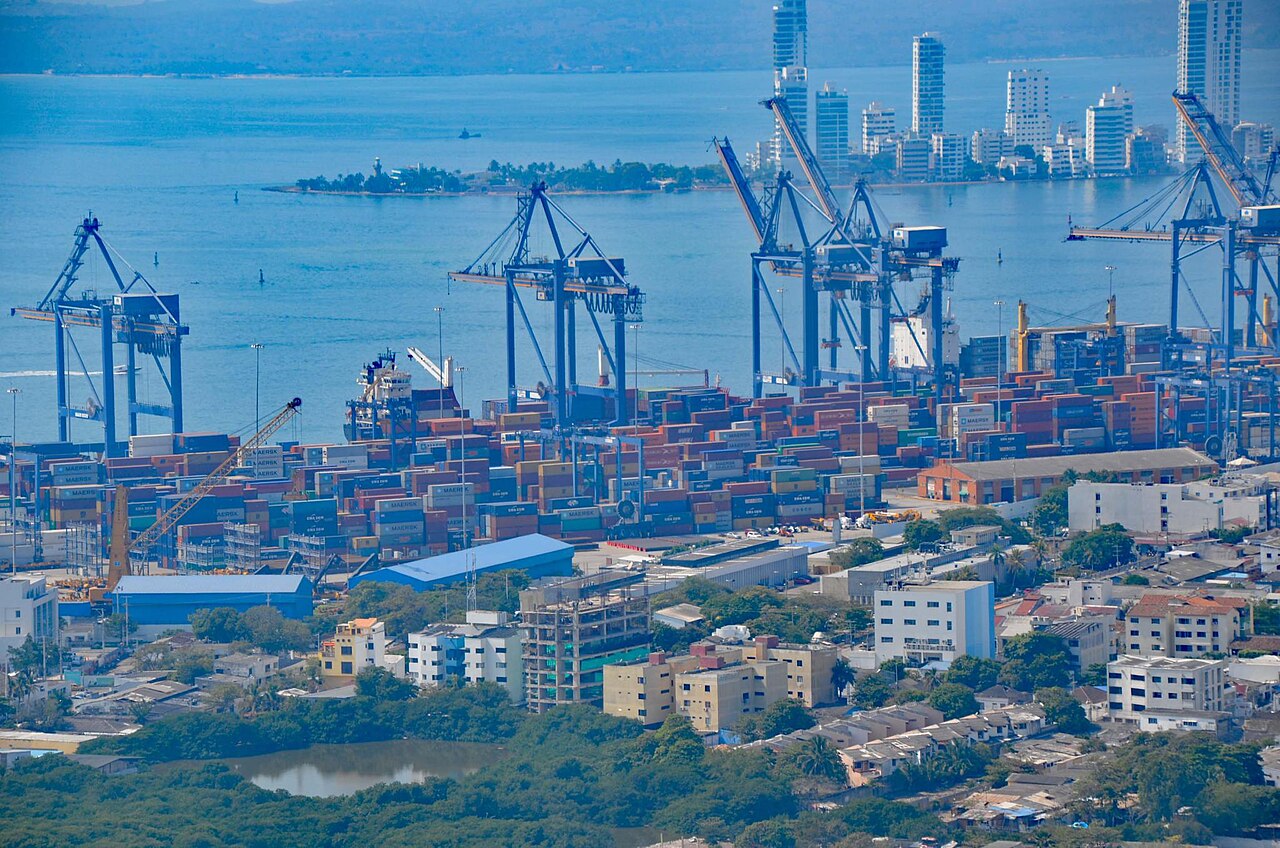
Gold Up, Coffee Down
Exports of fuels and mining products rose 23.8% to US$1.79 billion and made up 40.1% of the total. Gold exports more than doubled to US$707.6 million from US$311.9 million, a gain of 126.9%.
Coffee sales fell 23.5% to US$404.2 million, and the broader group of farm products and foods dropped 16.0% to US$1.07 billion. Colombia shipped 11.9 million barrels of crude oil in August, up 2.4% from a year earlier.
Who Buys Colombian Goods
The United States took US$1.21 billion of Colombian exports, up 8.2%, which is 27.2% of the total and more than any other country. Panama came next with US$470.7 million, more than double a year earlier, driven by crude oil and gold.
On the agency’s country tables, Colombia ran a deficit with the United States of US$1.08 billion from January to August. That compares with US$340.5 million in all of 2025, so the balance with America has swung sharply against Colombia.
What the Trade Gap Means for the Peso
At about 3,154 pesos to the US dollar on 21 October 2026, the August deficit equals roughly 8.74 trillion pesos (about US$2.77 billion). A gap this wide means the country needs more foreign money to pay for its imports.
That financing comes from foreign investment, loans and bond sales. The Colombia trade deficit is one reason traders watch each monthly report when they price the Colombian peso and the country’s dollar debt.
What It Means for US Readers
The Colombia trade deficit is partly a US success story, since American fuel, corn and machinery sold far faster than goods from other big partners. If Colombian demand holds, that is good news for Gulf Coast refiners and Midwest grain farmers.
Investors in Colombian bonds or in oil and gold exporters should note that gold and crude, not coffee, drove export growth this month. A monthly gap near US$2.8 billion adds pressure on the peso, which also affects the cost of travel and property in Colombia.
What Is Not Known
The statistics agency does not say why gasoline and diesel imports rose so sharply. Nor does it say whether the Colombia trade deficit will stay this wide in September.
All figures are provisional and the agency can revise them in later months. The deficit counts goods only and leaves out services, tourism income and money sent home by Colombians abroad.
More on Colombia’s Economy
Our guide to who runs Colombia’s economy explains the ministries, the central bank and the companies behind these numbers. It is a useful starting point for readers new to the country.
The agency publishes trade figures monthly, and the September report is due in November. Each release shows whether the fuel import surge continues.
More: Colombia news in English, every day from The Rio Times.
Frequently Asked Questions
What is the Colombia trade deficit?
The Colombia trade deficit in August 2026 was US$2.77 billion, up from US$1.65 billion in August 2025. It means Colombia spent that much more on imported goods than it earned from exports.
Why did Colombian imports rise so much?
Imports rose 31.7%, led by a 190.1% jump in fuels, plus higher purchases of machinery, chemicals and food. The statistics agency does not explain the fuel surge.
What does Colombia buy from the United States?
Gasoline, diesel-type gas oils, corn and some crude oil drove the 48.8% rise in imports from the US to US$1.74 billion. American goods made up 22.5% of Colombia’s imports in August.
What does Colombia sell abroad?
Oil, coal, gold and coffee are among the main exports, and fuels and mining products made up 40.1% of August sales. The United States was the biggest buyer with 27.2% of the total.
Does the Colombia trade deficit hurt the peso?
A wider gap raises Colombia’s need for foreign money, which can weigh on the peso. The agency gives no view on the currency, and the peso was at about 3,154 per US dollar on 21 October 2026.
Sources: DANE (National Administrative Department of Statistics), Balanza comercial, 21 October 2026; DANE, Importaciones (IMP) boletín técnico, agosto 2026, 21 October 2026; DANE, Exportaciones (EXPO) boletín técnico, agosto 2026, 5 October 2026; DANE, Balanza comercial mensual (anexo), 21 October 2026; DANE, Balanza comercial por grupos y países (anexo), 21 October 2026.
In depth
Editorial responsibility: Matthias Camenzind, Editor-in-Chief · Editorial standards · Report an error