IBOV 185,188.13 ▼ 0.01% IPSA 11,315.26 ▼ 1.14% IPC MEX 65,473.16 ▲ 0.91% MERVAL 3,058,093 ▼ 1.55% COLCAP 2,534.46 ▲ 1.81% BVL PERÚ 59,719.97 ▲ 0.43% USD/BRL5.10▲ 0.17% USD/MXN16.92▼ 0.31% USD/CLP930.46▼ 0.76% USD/COP3,142▼ 0.86% USD/PEN3.36▼ 0.04% USD/ARS1,508▼ 0.17% USD/UYU40.23▲ 1.13% USD/PYG5,924▲ 2.31% USD/BOB12.30▲ 4.75% USD/DOP58.65▲ 0.17% USD/CRC447.49▲ 1.34% USD/GTQ7.63▲ 2.30% USD/HNL26.84▲ 1.66% USD/NIO36.62▲ 0.71% USD/VES802.80▼ 0.13% USD/PAB1.00— 0.00% USD/BZD2.00— 0.00% USD/JMD 157.28 — 0.00% USD/TTD6.65▲ 0.05% EUR/BRL5.93▼ 0.64% BRENT 88.88 ▼ 0.03% WTI 83.11 ▼ 0.11% IRON ORE 161.91 — — COPPER 6.61 ▲ 0.03% GOLD 4,461 ▲ 1.78% SILVER 65.59 ▲ 1.26% SOY 1,184 ▲ 3.20% CORN 480.50 ▲ 10.02% WHEAT 655.00 ▲ 3.93% COFFEE 317.25 ▼ 5.51% SUGAR 16.43 ▼ 1.79% ORANGE JUICE 138.55 ▼ 0.47% COTTON 85.03 ▲ 2.33% COCOA 5,719 ▲ 3.18% BEEF 223.60 ▼ 3.93% CATTLE 339.10 ▼ 3.16% LITHIUM 75.20 ▲ 1.47% PETR4 41.64 ▼ 0.05% VALE3 72.97 ▲ 0.83% ITUB4 38.60 ▼ 1.03% BBDC4 16.85 ▲ 0.36% ABEV3 14.89 ▼ 0.80% BBAS3 19.37 ▲ 0.47% B3SA3 14.26 ▼ 0.21% WEGE3 47.59 ▲ 0.49% PRIO3 59.14 ▼ 0.19% SUZB3 41.33 ▲ 2.35% RENT3 34.68 ▼ 0.09% AZZA3 15.89 ▼ 2.63% CSAN3 3.22 ▼ 1.83% RAIZ4 0.25 — 0.00% PCAR3 2.75 ▼ 0.36% GMAT3 3.65 ▼ 1.08% PSSA3 48.13 ▼ 0.54% CVCB3 1.33 ▼ 2.92% POSI3 3.36 ▲ 2.44% SLCE3 13.34 ▲ 0.30% NATU3 8.14 ▼ 0.73% IBOV 185,188.13 ▼ 0.01% IPSA 11,315.26 ▼ 1.14% IPC MEX 65,473.16 ▲ 0.91% MERVAL 3,058,093 ▼ 1.55% COLCAP 2,534.46 ▲ 1.81% BVL PERÚ 59,719.97 ▲ 0.43% USD/BRL 5.16 ▲ 0.01% USD/MXN 17.06 ▼ 0.24% USD/CLP 913.98 ▲ 0.04% USD/COP 3,140 ▲ 0.03% USD/PEN 3.36 ▼ 0.66% USD/ARS 1,493 ▲ 0.10% USD/UYU 40.27 ▲ 1.24% USD/PYG 5,939 ▲ 1.68% USD/BOB 11.64 ▼ 0.76% USD/DOP 58.34 ▲ 1.25% USD/CRC 445.92 ▲ 0.89% USD/GTQ 7.62 ▲ 2.21% USD/HNL 26.79 ▲ 1.57% USD/NIO 36.62 ▲ 0.69% USD/VES 762.44 ▼ 0.13% USD/PAB 1.00 — 0.00% USD/BZD 2.00 — 0.00% USD/JMD 157.28 — 0.00% USD/TTD 6.70 ▲ 0.61% EUR/BRL 5.95 ▲ 1.01% BRENT 88.88 ▼ 0.03% WTI 83.11 ▼ 0.11% IRON ORE 161.91 — — COPPER 6.61 ▲ 0.03% GOLD 4,461 ▲ 1.78% SILVER 65.59 ▲ 1.26% SOY 1,184 ▲ 3.20% CORN 480.50 ▲ 10.02% WHEAT 655.00 ▲ 3.93% COFFEE 317.25 ▼ 5.51% SUGAR 16.43 ▼ 1.79% ORANGE JUICE 138.55 ▼ 0.47% COTTON 85.03 ▲ 2.33% COCOA 5,719 ▲ 3.18% BEEF 223.60 ▼ 3.93% CATTLE 339.10 ▼ 3.16% LITHIUM 75.20 ▲ 1.47% PETR4 41.64 ▼ 0.05% VALE3 72.97 ▲ 0.83% ITUB4 38.60 ▼ 1.03% BBDC4 16.85 ▲ 0.36% ABEV3 14.89 ▼ 0.80% BBAS3 19.37 ▲ 0.47% B3SA3 14.26 ▼ 0.21% WEGE3 47.59 ▲ 0.49% PRIO3 59.14 ▼ 0.19% SUZB3 41.33 ▲ 2.35% RENT3 34.68 ▼ 0.09% AZZA3 15.89 ▼ 2.63% CSAN3 3.22 ▼ 1.83% RAIZ4 0.25 — 0.00% PCAR3 2.75 ▼ 0.36% GMAT3 3.65 ▼ 1.08% PSSA3 48.13 ▼ 0.54% CVCB3 1.33 ▼ 2.92% POSI3 3.36 ▲ 2.44% SLCE3 13.34 ▲ 0.30% NATU3 8.14 ▼ 0.73%
since 2009
Thursday, September 3, 2026

U.S. Dollar Slides Versus Brazilian Real on Inflation Data and Tariff Concerns

By · September 12, 2025 · 2 min read

Daily Brief

The morning intel from across Latin America. Free.

By subscribing you agree to our privacy policy. We never share your email.

Traders pushed the US dollar lower against the Brazilian real on September 11, 2025. The exchange rate closed at R$5.3922, marking a 0.27% drop. Official economic reports drove this shift.

US Consumer Price Index climbed 0.4% in August, beating the 0.3% estimate. The yearly figure stayed at 2.9%. Unemployment claims surged to 263,000, topping forecasts of 235,000.

Experts projected core PCE inflation at 0.22% for the month. They highlighted limited effects from tariffs on prices. Investors now expect Federal Reserve interest rate reductions.

Meanwhile, Brazil’s top court convicted ex-President Jair Bolsonaro of five crimes linked to a coup attempt. The vote tally hit 4-1. Markets watch for US responses.

In July, President Donald Trump applied 50% tariffs to Brazilian goods. He blamed the ongoing trial. This move strains bilateral trade relations.
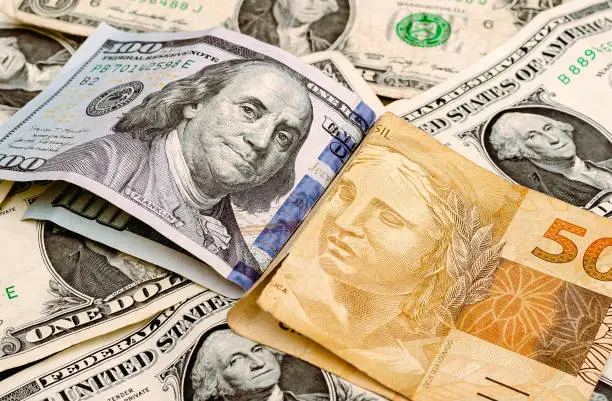
U.S. Dollar Slides Versus Brazilian Real on Inflation Data and Tariff Concerns
U.S. Dollar Slides Versus Brazilian Real on Inflation Data and Tariff Concerns. (Photo Internet reproduction)
One-stop reference
Company Intelligence
Every listed company in Latin America — financials, ownership and structure for 1,450+ companies across 26 exchanges, in one place.
Browse the directory →
RT
Ask Rio Times
Latin American markets, currencies and companies.
Open the full Ask Rio Times →

Mercantile views stress how tariffs shield US markets yet harm Brazilian exporters. Brazil’s real benefits from strong stock performance. Domestic deflation supports economic resilience.

Broader factors involve global liquidity and risk appetite. The DXY index dipped 0.34% that day. It currently reads 97.6378. Overnight trading saw USD/BRL ease to 5.3895 by September 12 morning.

Activity stayed calm. Brazil’s central bank halted dubious transfers to aid stability. Charts reveal a firm downtrend in daily and 4-hour views. Price pierced the 200-day simple moving average at 5.6300.

This marks a turn from peaks over 6.0000. The 50-period exponential moving average undercut the 200-period one on 4-hour. Bearish force grows. Relative Strength Index nears 40, hinting at oversold state.

MACD shows negative bars, signaling momentum loss. Bollinger Bands tightened, pointing to low volatility between 5.3800 and 5.4000. Volume dropped during rises, backing sellers. Support holds at 5.3688, resistance at 5.4209.

A support break eyes 5.3500. The yellow Global Liquidity Index NDQ declined steadily. It reached about 37.76. Reduced liquidity challenges trade funding worldwide.

Projections see USD/BRL at 5.293 by late September. Downward trend continues. Traders bet on real advances with Fed easing. Brazil-focused ETFs attracted inflows in 2025.

May alone drew over $464 million. Such capital flows strengthen the currency. Trading volumes followed standard forex patterns. No unusual surges appeared. Political tensions stay managed so far.

Upcoming central bank meetings draw focus. The Fed and Brazil’s authority decide rates next week. Cuts seem likely. These events underscore policy and trade interplay. Firms navigate exchange risks. Observers track impacts on commerce.

This article was produced by The Rio Times’ automated newsroom system. How we use AI · Report an error

LatAm Markets: Live Signals → — real-time movers, turnover leaders and FX across Latin America.

Read More from The Rio Times

The Rio Times · Power Map
See who really holds power in Latin America
Click to open the Power Map

Rotate for Best Experience

This report is optimized for landscape viewing. Rotate your phone for the full experience.