IBOV 184,178.92 ▼ 1.62% IPSA 11,199.62 ▼ 0.19% IPC MEX 63,924.77 ▼ 0.28% MERVAL 3,115,519 ▲ 0.54% COLCAP 2,596.75 ▲ 0.27% BVL PERÚ 59,184.75 ▼ 0.94% USD/BRL5.15▲ 0.58% USD/MXN17.11▲ 0.92% USD/CLP955.36▲ 1.37% USD/COP3,104▲ 0.80% USD/PEN3.38▲ 0.62% USD/ARS1,511▲ 0.12% USD/UYU40.20▼ 0.15% USD/PYG5,985▲ 1.38% USD/BOB11.45▼ 4.42% USD/DOP58.98▲ 0.22% USD/CRC444.07▼ 0.78% USD/GTQ7.62▼ 0.07% USD/HNL26.85— 0.00% USD/NIO36.62— 0.00% USD/VES840.10▼ 0.13% USD/PAB1.00— 0.00% USD/BZD2.00— 0.00% USD/JMD 157.28 — 0.00% USD/TTD6.74▼ 0.08% EUR/BRL5.95▼ 0.04% BRENT 88.88 ▼ 0.03% WTI 83.11 ▼ 0.11% IRON ORE 161.91 — — COPPER 6.61 ▲ 0.03% GOLD 4,461 ▲ 1.78% SILVER 65.59 ▲ 1.26% SOY 1,184 ▲ 3.20% CORN 480.50 ▲ 10.02% WHEAT 655.00 ▲ 3.93% COFFEE 317.25 ▼ 5.51% SUGAR 16.43 ▼ 1.79% ORANGE JUICE 138.55 ▼ 0.47% COTTON 85.03 ▲ 2.33% COCOA 5,719 ▲ 3.18% BEEF 223.60 ▼ 3.93% CATTLE 339.10 ▼ 3.16% LITHIUM 75.20 ▲ 1.47% PETR4 41.64 ▼ 0.05% VALE3 72.97 ▲ 0.83% ITUB4 38.60 ▼ 1.03% BBDC4 16.85 ▲ 0.36% ABEV3 14.89 ▼ 0.80% BBAS3 19.37 ▲ 0.47% B3SA3 14.26 ▼ 0.21% WEGE3 47.59 ▲ 0.49% PRIO3 59.14 ▼ 0.19% SUZB3 41.33 ▲ 2.35% RENT3 34.68 ▼ 0.09% AZZA3 15.89 ▼ 2.63% CSAN3 3.22 ▼ 1.83% RAIZ4 0.25 — 0.00% PCAR3 2.75 ▼ 0.36% GMAT3 3.65 ▼ 1.08% PSSA3 48.13 ▼ 0.54% CVCB3 1.33 ▼ 2.92% POSI3 3.36 ▲ 2.44% SLCE3 13.34 ▲ 0.30% NATU3 8.14 ▼ 0.73% IBOV 184,178.92 ▼ 1.62% IPSA 11,199.62 ▼ 0.19% IPC MEX 63,924.77 ▼ 0.28% MERVAL 3,115,519 ▲ 0.54% COLCAP 2,596.75 ▲ 0.27% BVL PERÚ 59,184.75 ▼ 0.94% USD/BRL 5.16 ▲ 0.01% USD/MXN 17.06 ▼ 0.24% USD/CLP 913.98 ▲ 0.04% USD/COP 3,140 ▲ 0.03% USD/PEN 3.36 ▼ 0.66% USD/ARS 1,493 ▲ 0.10% USD/UYU 40.27 ▲ 1.24% USD/PYG 5,939 ▲ 1.68% USD/BOB 11.64 ▼ 0.76% USD/DOP 58.34 ▲ 1.25% USD/CRC 445.92 ▲ 0.89% USD/GTQ 7.62 ▲ 2.21% USD/HNL 26.79 ▲ 1.57% USD/NIO 36.62 ▲ 0.69% USD/VES 762.44 ▼ 0.13% USD/PAB 1.00 — 0.00% USD/BZD 2.00 — 0.00% USD/JMD 157.28 — 0.00% USD/TTD 6.70 ▲ 0.61% EUR/BRL 5.95 ▲ 1.01% BRENT 88.88 ▼ 0.03% WTI 83.11 ▼ 0.11% IRON ORE 161.91 — — COPPER 6.61 ▲ 0.03% GOLD 4,461 ▲ 1.78% SILVER 65.59 ▲ 1.26% SOY 1,184 ▲ 3.20% CORN 480.50 ▲ 10.02% WHEAT 655.00 ▲ 3.93% COFFEE 317.25 ▼ 5.51% SUGAR 16.43 ▼ 1.79% ORANGE JUICE 138.55 ▼ 0.47% COTTON 85.03 ▲ 2.33% COCOA 5,719 ▲ 3.18% BEEF 223.60 ▼ 3.93% CATTLE 339.10 ▼ 3.16% LITHIUM 75.20 ▲ 1.47% PETR4 41.64 ▼ 0.05% VALE3 72.97 ▲ 0.83% ITUB4 38.60 ▼ 1.03% BBDC4 16.85 ▲ 0.36% ABEV3 14.89 ▼ 0.80% BBAS3 19.37 ▲ 0.47% B3SA3 14.26 ▼ 0.21% WEGE3 47.59 ▲ 0.49% PRIO3 59.14 ▼ 0.19% SUZB3 41.33 ▲ 2.35% RENT3 34.68 ▼ 0.09% AZZA3 15.89 ▼ 2.63% CSAN3 3.22 ▼ 1.83% RAIZ4 0.25 — 0.00% PCAR3 2.75 ▼ 0.36% GMAT3 3.65 ▼ 1.08% PSSA3 48.13 ▼ 0.54% CVCB3 1.33 ▼ 2.92% POSI3 3.36 ▲ 2.44% SLCE3 13.34 ▲ 0.30% NATU3 8.14 ▼ 0.73%
since 2009
Monday, September 14, 2026

Tesla’s Sales Slip: First Annual Decline in Over a Decade

By · January 2, 2025 · 2 min read

The LatAm Brief

One email, every weekday morning. What moved in Latin American markets, politics and expat life.

Yesterday’s subject line: “Brazil's Supreme Court judges one of its own”

Free. We send a confirmation link first — nothing arrives until you click it. Unsubscribe with one click in any edition. If you stop opening us for 30 days we stop sending by ourselves, as we assume the interest is no longer there. See our privacy policy. We never share your email.

Tesla, the electric vehicle giant led by Elon Musk, has reported its first annual sales decline in over a decade. The company delivered 1,789,226 vehicles globally in 2024, a 1.1% decrease from 2023.

This unexpected downturn marks a significant shift in the rapidly evolving EV market. The fourth quarter of 2024 saw Tesla deliver 495,570 vehicles, falling short of analysts’ expectations.

Despite this setback, Tesla’s stock performed well in 2024, with a 63% increase throughout the year. The company’s sales decline reflects growing competition in the EV sector. Chinese rival BYD experienced remarkable growth in 2024.

BYD sold 1.76 million pure electric vehicles, a 12% increase from 2023. Their total new energy vehicle sales, including plug-in hybrids, reached 4,272,145 units, a 41.3% increase from the previous year.

Tesla’s sales decline can be attributed to several factors. Increased competition from China, Europe, and the United States has given consumers more choices.
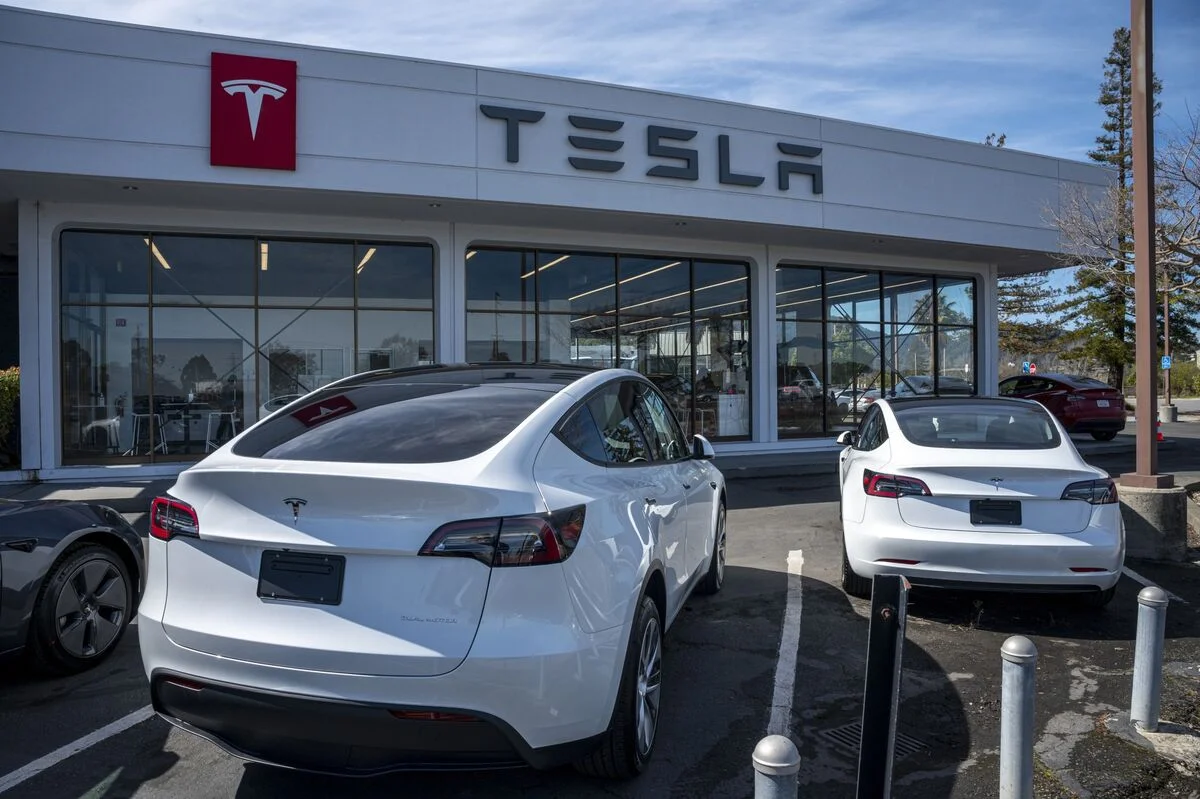
Tesla's Sales Slip: First Annual Decline in Over a Decade
Tesla’s Sales Slip: First Annual Decline in Over a Decade.
One-stop reference
Company Intelligence
Every listed company in Latin America — financials, ownership and structure for 1,450+ companies across 26 exchanges, in one place.
Browse the directory →
RT
Ask Rio Times
17 years of Latin America reporting, on demand.
Open the full Ask Rio Times →

Market saturation in key regions like Europe and China has slowed Tesla’s growth. Pricing pressure persists despite price reductions and buyer incentives.

The Evolving Battle for EV Market Supremacy

The company still represents nearly half of all EV sales in the United States. Tesla is focusing on autonomous driving technology and new vehicle models for future growth.

Their brand strength and technological advancements remain significant assets in the competitive landscape. BYD’s impressive growth suggests it’s gaining significant ground in the EV market.

The Chinese company’s diverse product lineup, including affordable models, appeals to a broad consumer base. BYD’s strong performance in China provides a solid foundation for global expansion.

The EV market is entering a new phase of intense competition and innovation. Both Tesla and BYD will need to adapt to changing consumer preferences and technological advancements.

The battle for EV supremacy is far from over as the market continues to evolve. Tesla’s focus on autonomous driving and new vehicle models may drive future growth.

BYD’s aggressive expansion and diverse product range position it as a strong competitor. The outcome of this rivalry will shape the future of the global EV market.

This article was produced by The Rio Times’ automated newsroom system. How we use AI · Report an error

Read More from The Rio Times

The Rio Times · Power Map
See who really holds power in Latin America
Click to open the Power Map

Rotate for Best Experience

This report is optimized for landscape viewing. Rotate your phone for the full experience.