IBOV 177,418.78 ▲ 1.00% IPSA 11,315.26 ▼ 1.14% IPC MEX 65,430.32 ▼ 0.08% MERVAL 3,033,848 — 0.00% COLCAP 2,425.08 ▼ 1.33% BVL PERÚ 59,928.30 ▼ 0.80% USD/BRL5.18▲ 0.01% USD/MXN17.00▲ 0.03% USD/CLP936.04▲ 0.19% USD/COP3,223▲ 0.68% USD/PEN3.36▼ 0.14% USD/ARS1,509▼ 0.28% USD/UYU40.29▲ 0.05% USD/PYG5,892▼ 0.13% USD/BOB11.84▲ 0.51% USD/DOP58.61▲ 0.46% USD/CRC446.47▼ 0.04% USD/GTQ7.62▼ 0.02% USD/HNL26.84— 0.00% USD/NIO36.62▲ 0.14% USD/VES796.33▲ 0.29% USD/PAB1.00— 0.00% USD/BZD2.00— 0.00% USD/JMD 157.28 — 0.00% USD/TTD6.69▼ 0.37% EUR/BRL6.01▼ 0.01% BRENT 88.88 ▼ 0.03% WTI 83.11 ▼ 0.11% IRON ORE 161.91 — — COPPER 6.61 ▲ 0.03% GOLD 4,461 ▲ 1.78% SILVER 65.59 ▲ 1.26% SOY 1,184 ▲ 3.20% CORN 480.50 ▲ 10.02% WHEAT 655.00 ▲ 3.93% COFFEE 317.25 ▼ 5.51% SUGAR 16.43 ▼ 1.79% ORANGE JUICE 138.55 ▼ 0.47% COTTON 85.03 ▲ 2.33% COCOA 5,719 ▲ 3.18% BEEF 223.60 ▼ 3.93% CATTLE 339.10 ▼ 3.16% LITHIUM 75.20 ▲ 1.47% PETR4 41.64 ▼ 0.05% VALE3 72.97 ▲ 0.83% ITUB4 38.60 ▼ 1.03% BBDC4 16.85 ▲ 0.36% ABEV3 14.89 ▼ 0.80% BBAS3 19.37 ▲ 0.47% B3SA3 14.26 ▼ 0.21% WEGE3 47.59 ▲ 0.49% PRIO3 59.14 ▼ 0.19% SUZB3 41.33 ▲ 2.35% RENT3 34.68 ▼ 0.09% AZZA3 15.89 ▼ 2.63% CSAN3 3.22 ▼ 1.83% RAIZ4 0.25 — 0.00% PCAR3 2.75 ▼ 0.36% GMAT3 3.65 ▼ 1.08% PSSA3 48.13 ▼ 0.54% CVCB3 1.33 ▼ 2.92% POSI3 3.36 ▲ 2.44% SLCE3 13.34 ▲ 0.30% NATU3 8.14 ▼ 0.73% IBOV 177,418.78 ▲ 1.00% IPSA 11,315.26 ▼ 1.14% IPC MEX 65,430.32 ▼ 0.08% MERVAL 3,033,848 — 0.00% COLCAP 2,425.08 ▼ 1.33% BVL PERÚ 59,928.30 ▼ 0.80% USD/BRL 5.16 ▲ 0.01% USD/MXN 17.06 ▼ 0.24% USD/CLP 913.98 ▲ 0.04% USD/COP 3,140 ▲ 0.03% USD/PEN 3.36 ▼ 0.66% USD/ARS 1,493 ▲ 0.10% USD/UYU 40.27 ▲ 1.24% USD/PYG 5,939 ▲ 1.68% USD/BOB 11.64 ▼ 0.76% USD/DOP 58.34 ▲ 1.25% USD/CRC 445.92 ▲ 0.89% USD/GTQ 7.62 ▲ 2.21% USD/HNL 26.79 ▲ 1.57% USD/NIO 36.62 ▲ 0.69% USD/VES 762.44 ▼ 0.13% USD/PAB 1.00 — 0.00% USD/BZD 2.00 — 0.00% USD/JMD 157.28 — 0.00% USD/TTD 6.70 ▲ 0.61% EUR/BRL 5.95 ▲ 1.01% BRENT 88.88 ▼ 0.03% WTI 83.11 ▼ 0.11% IRON ORE 161.91 — — COPPER 6.61 ▲ 0.03% GOLD 4,461 ▲ 1.78% SILVER 65.59 ▲ 1.26% SOY 1,184 ▲ 3.20% CORN 480.50 ▲ 10.02% WHEAT 655.00 ▲ 3.93% COFFEE 317.25 ▼ 5.51% SUGAR 16.43 ▼ 1.79% ORANGE JUICE 138.55 ▼ 0.47% COTTON 85.03 ▲ 2.33% COCOA 5,719 ▲ 3.18% BEEF 223.60 ▼ 3.93% CATTLE 339.10 ▼ 3.16% LITHIUM 75.20 ▲ 1.47% PETR4 41.64 ▼ 0.05% VALE3 72.97 ▲ 0.83% ITUB4 38.60 ▼ 1.03% BBDC4 16.85 ▲ 0.36% ABEV3 14.89 ▼ 0.80% BBAS3 19.37 ▲ 0.47% B3SA3 14.26 ▼ 0.21% WEGE3 47.59 ▲ 0.49% PRIO3 59.14 ▼ 0.19% SUZB3 41.33 ▲ 2.35% RENT3 34.68 ▼ 0.09% AZZA3 15.89 ▼ 2.63% CSAN3 3.22 ▼ 1.83% RAIZ4 0.25 — 0.00% PCAR3 2.75 ▼ 0.36% GMAT3 3.65 ▼ 1.08% PSSA3 48.13 ▼ 0.54% CVCB3 1.33 ▼ 2.92% POSI3 3.36 ▲ 2.44% SLCE3 13.34 ▲ 0.30% NATU3 8.14 ▼ 0.73%
since 2009
Tuesday, September 1, 2026

U.S. Manufacturing Shows Signs of Recovery Amid Ongoing Challenges

By · January 3, 2025 · 2 min read

Daily Brief

The morning intel from across Latin America. Free.

By subscribing you agree to our privacy policy. We never share your email.

The Institute for Supply Management (ISM) reported a slight improvement in US manufacturing activity for December 2024. The Manufacturing PMI rose to 49.3 from 48.4 in November, surpassing market expectations of 48.4.

This increase marks the ninth consecutive month of contraction in the sector. Three out of five subindices now indicate expansion. The New Orders Index climbed to 52.5 from 50.4, signaling growing demand.

The Production Index also improved, reaching 50.3 from 48.4. These positive shifts suggest a potential turnaround for manufacturers. However, challenges persist in the labor market.

The Employment Index declined to 45.3 from 48.1, reflecting ongoing workforce adjustments. Companies continue to right-size their staff levels to match current demand and future expectations.

Inventory management remains a focus for manufacturers. The Inventories Index showed a slight increase to 48.4 from 48.1, though still in contraction territory.
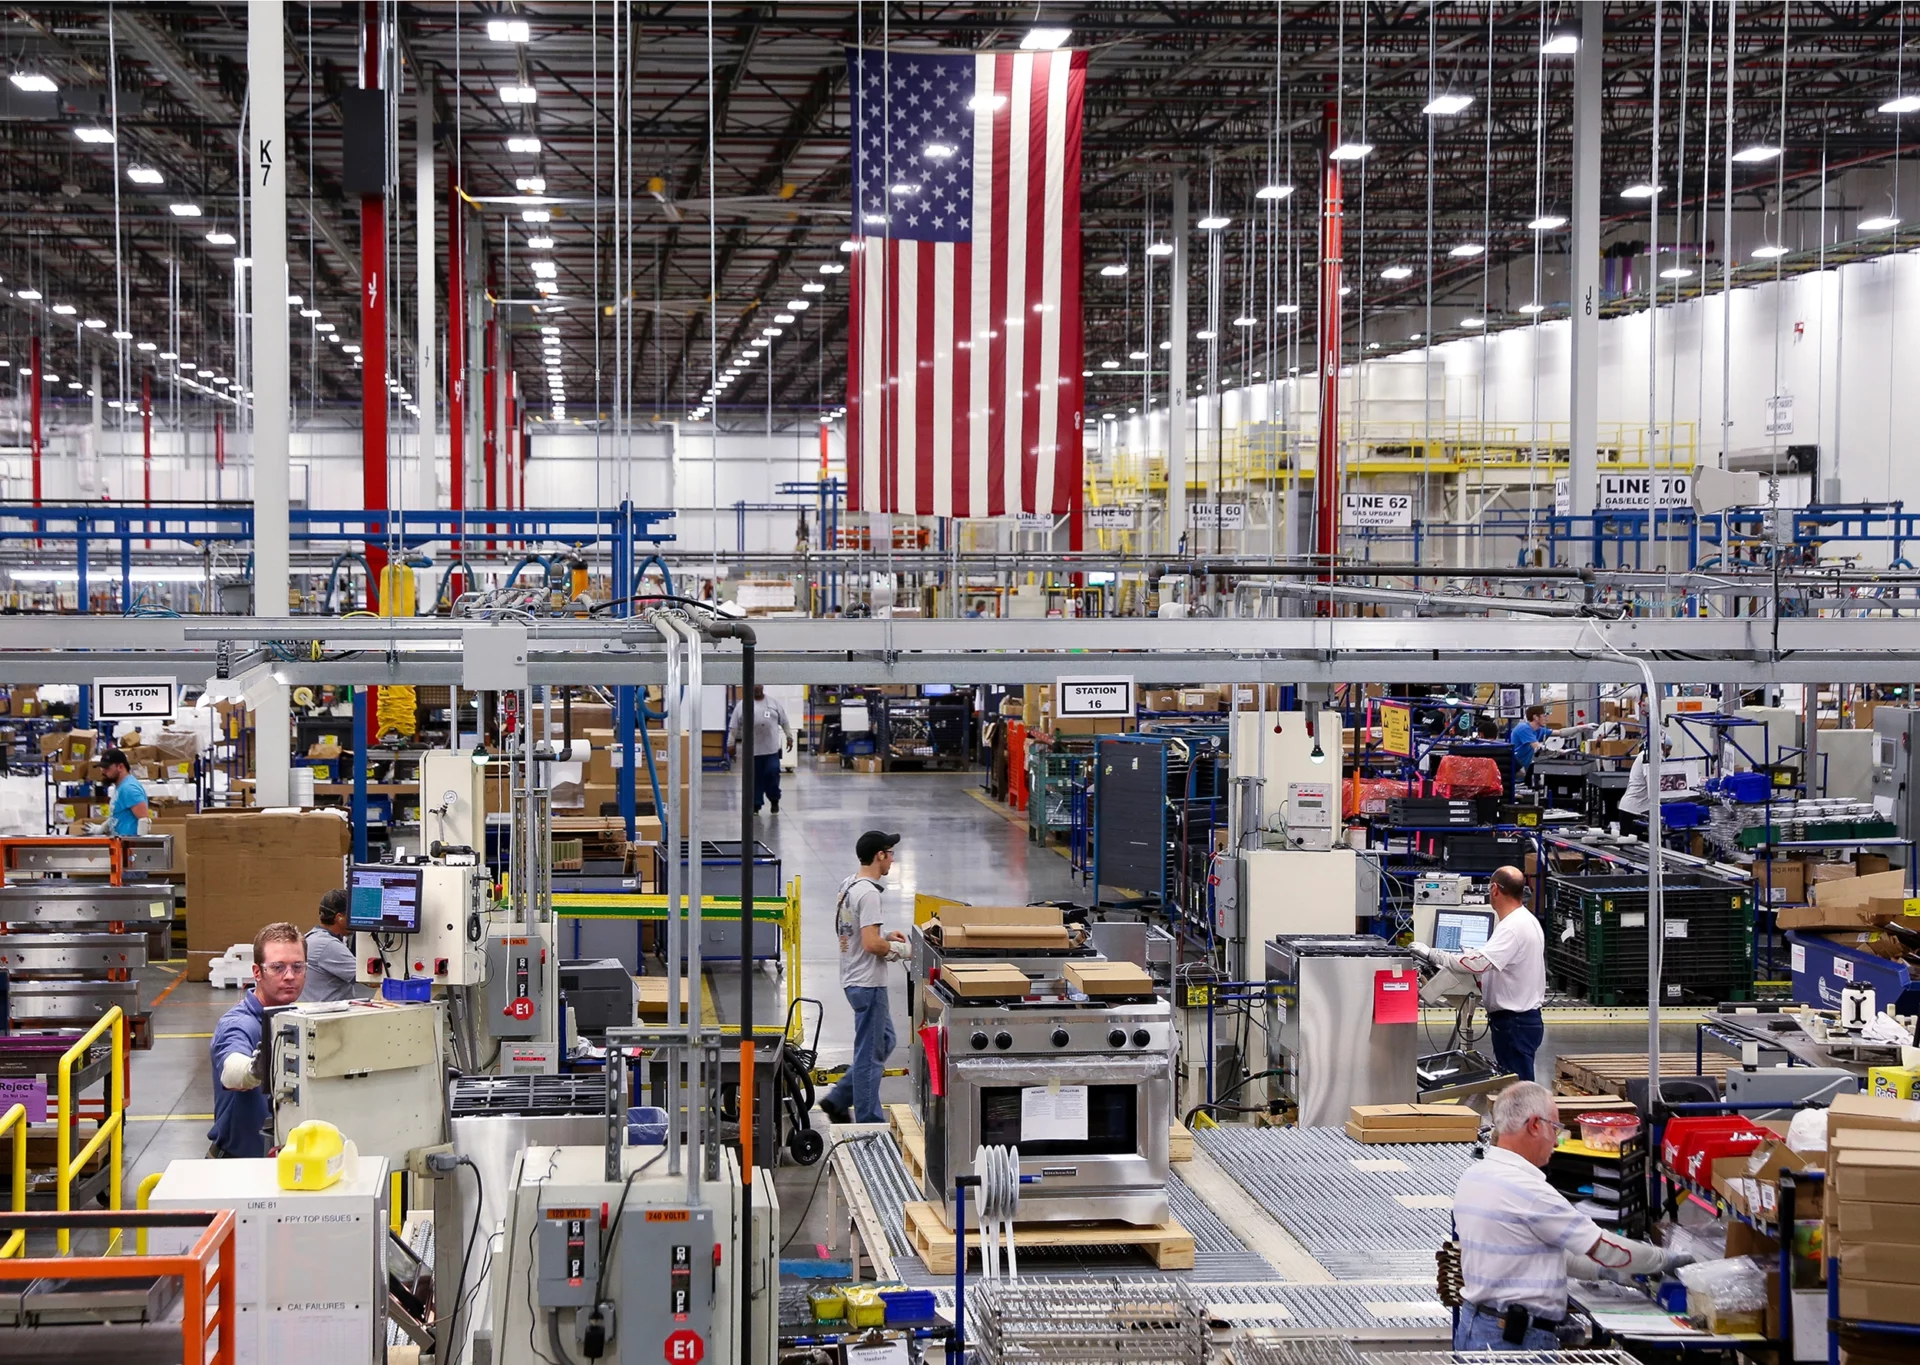
U.S. Manufacturing Shows Signs of Recovery Amid Ongoing Challenges
U.S. Manufacturing Shows Signs of Recovery Amid Ongoing Challenges. (Photo Internet reproduction)
One-stop reference
Company Intelligence
Every listed company in Latin America — financials, ownership and structure for 1,450+ companies across 26 exchanges, in one place.
Browse the directory →
RT
Ask Rio Times
17 years of Latin America reporting, on demand.
Open the full Ask Rio Times →

This trend indicates cautious stock management amid uncertain demand conditions. Price pressures saw a moderate uptick. The Prices Index rose to 52.5 from 50.3, potentially impacting profit margins.

Manufacturers must navigate these cost increases while maintaining competitiveness. Timothy Fiore, Chair of the ISM Manufacturing Business Survey Committee, noted mixed conditions.

Demand shows signs of improvement, but production remains sluggish. Suppliers maintain capacity, with lead times improving despite some product shortages. The manufacturing sector’s performance aligns with broader economic trends.

It contributed to a 3.2% annualized GDP growth in the third quarter of 2024. Recent Federal Reserve rate cuts aim to support economic activity. Looking ahead, the sector faces both opportunities and challenges.

The incoming administration’s policies on taxes and tariffs could significantly impact manufacturers. Companies must remain agile to adapt to evolving market conditions.

This article was produced by The Rio Times’ automated newsroom system. How we use AI · Report an error

Read More from The Rio Times

The Rio Times · Power Map
See who really holds power in Latin America
Click to open the Power Map

Rotate for Best Experience

This report is optimized for landscape viewing. Rotate your phone for the full experience.