IBOV 175,664.62 ▲ 0.30% IPSA 11,445.90 ▼ 0.22% IPC MEX 65,561.46 ▼ 0.41% MERVAL 2,979,472 ▼ 0.72% COLCAP 2,457.87 ▼ 1.28% BVL PERÚ 60,779.49 ▼ 1.40% USD/BRL5.19▲ 0.45% USD/MXN17.03▲ 0.26% USD/CLP930.58▲ 0.45% USD/COP3,202▲ 2.39% USD/PEN3.35▼ 0.07% USD/ARS1,512— 0.00% USD/UYU40.27▲ 1.50% USD/PYG5,900▲ 0.50% USD/BOB11.78▲ 3.59% USD/DOP58.61▲ 0.96% USD/CRC446.65▲ 0.98% USD/GTQ7.62▲ 2.25% USD/HNL26.84▲ 0.40% USD/NIO36.62▼ 0.02% USD/VES789.69▼ 0.13% USD/PAB1.00— 0.00% USD/BZD2.00— 0.00% USD/JMD 157.28 — 0.00% USD/TTD6.72▲ 0.77% EUR/BRL6.01▲ 0.17% BRENT 88.88 ▼ 0.03% WTI 83.11 ▼ 0.11% IRON ORE 161.91 — — COPPER 6.61 ▲ 0.03% GOLD 4,461 ▲ 1.78% SILVER 65.59 ▲ 1.26% SOY 1,184 ▲ 3.20% CORN 480.50 ▲ 10.02% WHEAT 655.00 ▲ 3.93% COFFEE 317.25 ▼ 5.51% SUGAR 16.43 ▼ 1.79% ORANGE JUICE 138.55 ▼ 0.47% COTTON 85.03 ▲ 2.33% COCOA 5,719 ▲ 3.18% BEEF 223.60 ▼ 3.93% CATTLE 339.10 ▼ 3.16% LITHIUM 75.20 ▲ 1.47% PETR4 41.64 ▼ 0.05% VALE3 72.97 ▲ 0.83% ITUB4 38.60 ▼ 1.03% BBDC4 16.85 ▲ 0.36% ABEV3 14.89 ▼ 0.80% BBAS3 19.37 ▲ 0.47% B3SA3 14.26 ▼ 0.21% WEGE3 47.59 ▲ 0.49% PRIO3 59.14 ▼ 0.19% SUZB3 41.33 ▲ 2.35% RENT3 34.68 ▼ 0.09% AZZA3 15.89 ▼ 2.63% CSAN3 3.22 ▼ 1.83% RAIZ4 0.25 — 0.00% PCAR3 2.75 ▼ 0.36% GMAT3 3.65 ▼ 1.08% PSSA3 48.13 ▼ 0.54% CVCB3 1.33 ▼ 2.92% POSI3 3.36 ▲ 2.44% SLCE3 13.34 ▲ 0.30% NATU3 8.14 ▼ 0.73% IBOV 175,664.62 ▲ 0.30% IPSA 11,445.90 ▼ 0.22% IPC MEX 65,561.46 ▼ 0.41% MERVAL 2,979,472 ▼ 0.72% COLCAP 2,457.87 ▼ 1.28% BVL PERÚ 60,779.49 ▼ 1.40% USD/BRL 5.16 ▲ 0.01% USD/MXN 17.06 ▼ 0.24% USD/CLP 913.98 ▲ 0.04% USD/COP 3,140 ▲ 0.03% USD/PEN 3.36 ▼ 0.66% USD/ARS 1,493 ▲ 0.10% USD/UYU 40.27 ▲ 1.24% USD/PYG 5,939 ▲ 1.68% USD/BOB 11.64 ▼ 0.76% USD/DOP 58.34 ▲ 1.25% USD/CRC 445.92 ▲ 0.89% USD/GTQ 7.62 ▲ 2.21% USD/HNL 26.79 ▲ 1.57% USD/NIO 36.62 ▲ 0.69% USD/VES 762.44 ▼ 0.13% USD/PAB 1.00 — 0.00% USD/BZD 2.00 — 0.00% USD/JMD 157.28 — 0.00% USD/TTD 6.70 ▲ 0.61% EUR/BRL 5.95 ▲ 1.01% BRENT 88.88 ▼ 0.03% WTI 83.11 ▼ 0.11% IRON ORE 161.91 — — COPPER 6.61 ▲ 0.03% GOLD 4,461 ▲ 1.78% SILVER 65.59 ▲ 1.26% SOY 1,184 ▲ 3.20% CORN 480.50 ▲ 10.02% WHEAT 655.00 ▲ 3.93% COFFEE 317.25 ▼ 5.51% SUGAR 16.43 ▼ 1.79% ORANGE JUICE 138.55 ▼ 0.47% COTTON 85.03 ▲ 2.33% COCOA 5,719 ▲ 3.18% BEEF 223.60 ▼ 3.93% CATTLE 339.10 ▼ 3.16% LITHIUM 75.20 ▲ 1.47% PETR4 41.64 ▼ 0.05% VALE3 72.97 ▲ 0.83% ITUB4 38.60 ▼ 1.03% BBDC4 16.85 ▲ 0.36% ABEV3 14.89 ▼ 0.80% BBAS3 19.37 ▲ 0.47% B3SA3 14.26 ▼ 0.21% WEGE3 47.59 ▲ 0.49% PRIO3 59.14 ▼ 0.19% SUZB3 41.33 ▲ 2.35% RENT3 34.68 ▼ 0.09% AZZA3 15.89 ▼ 2.63% CSAN3 3.22 ▼ 1.83% RAIZ4 0.25 — 0.00% PCAR3 2.75 ▼ 0.36% GMAT3 3.65 ▼ 1.08% PSSA3 48.13 ▼ 0.54% CVCB3 1.33 ▼ 2.92% POSI3 3.36 ▲ 2.44% SLCE3 13.34 ▲ 0.30% NATU3 8.14 ▼ 0.73%
since 2009
Friday, August 28, 2026

Latest News Life & Society

Real Estate Trends in São Paulo: A Study of Rising Values

By · April 25, 2024 · 2 min read

Daily Brief

The morning intel from across Latin America. Free.

By subscribing you agree to our privacy policy. We never share your email.

In the bustling metropolis of São Paulo, the real estate market is showing signs of robust growth, with property prices ascending across several key neighborhoods.

This dynamic shift is highlighted in a recent study by QuintoAndar, which details the price variations within São Paulo.

It compares them to similar trends in Rio de Janeiro and Belo Horizonte during the first quarter of the year.

The spotlight shines on Rio de Janeiro, where properties saw a significant price increase of 12.5%, reaching an average cost of R$5,392 ($1,046) per square meter.

In contrast, São Paulo, with the highest average price per square meter at R$ 7,157 ($1,389), experienced a modest hike of 3.73%.
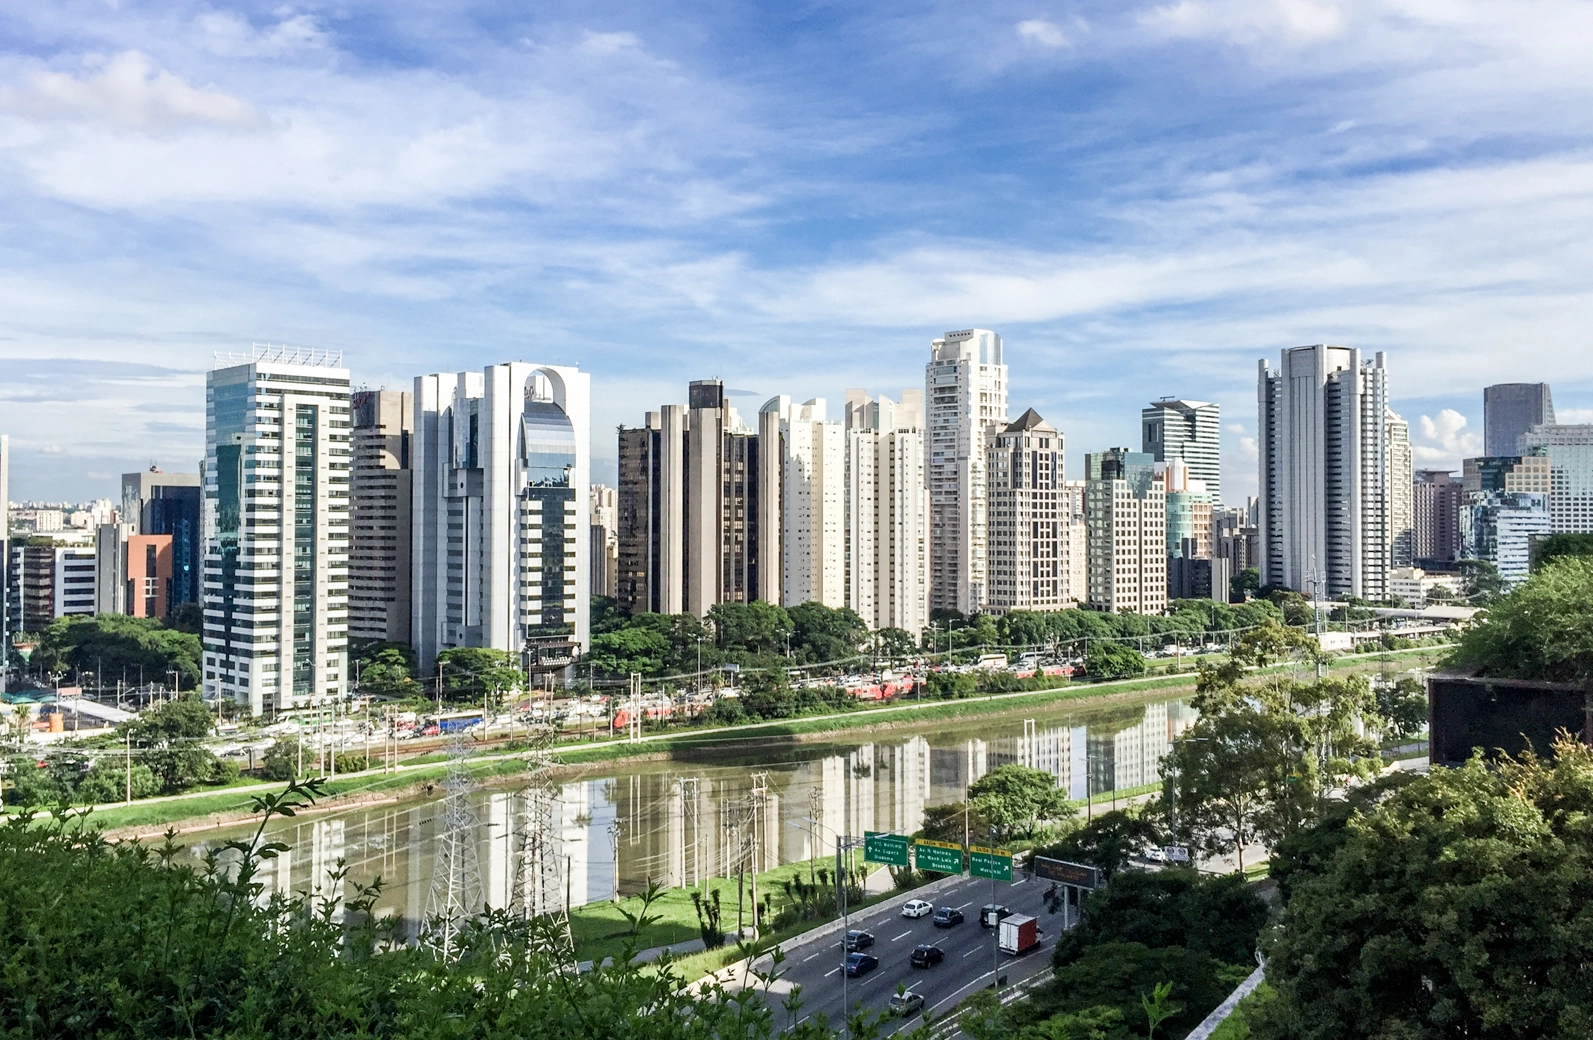
Real Estate Trends in São Paulo: A Study of Rising Values
Real Estate Trends in São Paulo: A Study of Rising Values. (Photo Internet reproduction)
One-stop reference
Company Intelligence
Every listed company in Latin America — financials, ownership and structure for 1,450+ companies across 26 exchanges, in one place.
Browse the directory →
RT
Ask Rio Times
17 years of Latin America reporting, on demand.
Open the full Ask Rio Times →

Meanwhile, Belo Horizonte marked a growth of 6.67%, with prices rounding off at R$ 4,800 ($932).

Evandro Luis Alves, an economist at QuintoAndar, notes a sustained rise in São Paulo and Rio. Unlike Belo Horizonte, which shows improvement yet still lags behind the rates from previous years.

Alves predicts an active market in 2024, spurred by the downward trend of Brazil’s central bank interest rate, Selic.

This drop encourages Brazilians to explore financed purchases, with improving conditions anticipated throughout the year.

In São Paulo, prices in upscale neighborhoods like Pinheiros, Moema, Brooklin, and Vila Mariana have surged past R$10,000 ($1,942) per square meter.

The Central region boasts the highest increase at 9%, with the Northern region trailing at a modest 1.2% growth.

Top property areas like Tatuapé, Vila Mariana, Mooca, and Ipiranga show diverse interest in locales.

Rental properties also promise potential returns, averaging 6% annually, influenced by various factors including size, location, and property condition.

The data highlights São Paulo’s thriving market, promising opportunities for buyers and sellers in its dynamic landscape.

This article was produced by The Rio Times’ automated newsroom system. How we use AI · Report an error

Read More from The Rio Times

The Rio Times · Power Map
See who really holds power in Latin America
Click to open the Power Map

Rotate for Best Experience

This report is optimized for landscape viewing. Rotate your phone for the full experience.