Oil Prices Ended the Week Near $105. Ten Million Barrels a Day Are Not Being Pumped
GLOBAL · ENERGY
Key Facts
- —Where it closed Brent settled at US$104.61 on Friday, up about nine percent on the week.
- —The spike Brent went above US$107 on Thursday after United States and Iranian strikes on tankers.
- —The real cause More than 10 million barrels a day of Gulf output is shut in, on the energy agency’s count.
- —Saudi Arabia It produced 5.97 million barrels a day in August, the lowest in more than thirty years.
- —The stocks Global inventories have drawn 507 million barrels since the war began, 95 million in August.
- —The catch Every major bank forecast sits fifteen to twenty-five dollars below Friday’s close.
Every major forecaster is still pricing a return to the eighties. The August production numbers, published on Friday, describe something that has not happened in three decades.
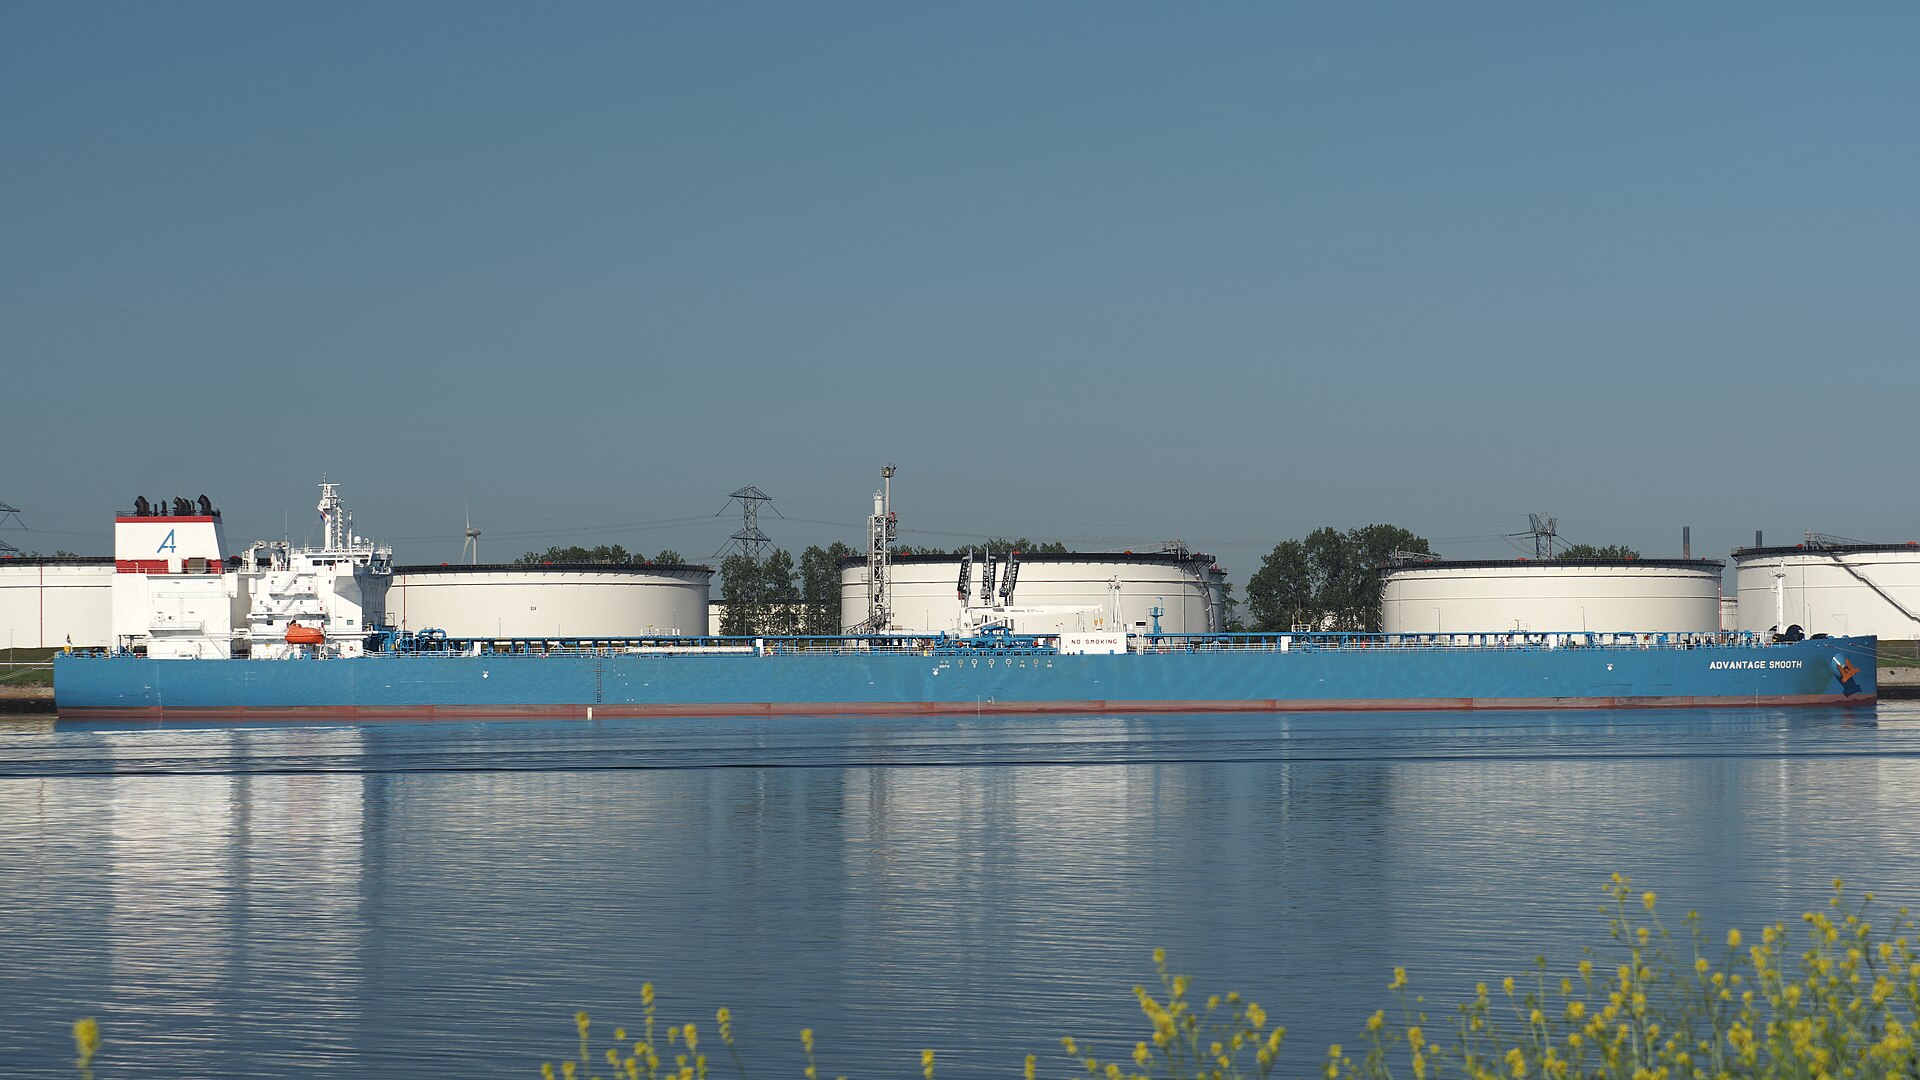
Oil prices ended last week near their highest in four months, and the reason is not a headline. It is that more than 10 million barrels a day of Gulf production is physically shut in.
Brent crude settled at US$104.61 on Friday 11 September. That was down 2.81 percent on the day but up about nine percent on the week.
West Texas Intermediate settled at US$100.05 the same day. Oil prices had not been this high in four months.
The week’s peak came on Thursday. Brent went above US$107 and the American benchmark passed US$100 for the first time since May.
Both had climbed the day before. Brent settled at US$101.21 on Wednesday and the American grade at US$96.05.
One correction is worth making because it has circulated widely. Wednesday’s close was not the first above US$100 since May, because Brent settled at US$100.69 on 23 July.
It was the highest close since 22 May, when Brent finished at US$103.54. The physical benchmark used to price much of the world’s crude has been above US$100 since 3 September, according to Reuters.
What Set It Off Last Week
United States Central Command announced late on Tuesday that it had destroyed five Iranian tankers. They were hit in the Gulf of Oman and near Kharg Island.
It named all five and said crews had been directed to abandon ship first. Video of the burning vessels was released.
The stated reason was that Iranian forces had sought to target an American warship twice in two days.
Iran retaliated overnight into Wednesday and claimed attacks on ten ships near the Strait of Hormuz. A seafarer was killed and another reported missing aboard a products tanker at anchorage off Dubai.
A second tanker carrying two million barrels of Iraqi fuel oil caught fire in Iraqi waters after a drone strike. Its 22 crew were unhurt.
Iranian forces also struck an air base in Jordan. The Jordanian military said it intercepted 18 of 20 ballistic missiles and reported no casualties.
The attacks did not stop for the weekend. A commercial vessel was struck near Qeshm Island late on Saturday, killing one person and injuring four.
The Numbers That Actually Matter
The energy agency published its monthly report on Friday and it is the most important document of the week. Saudi Arabia produced 5.97 million barrels a day in August.
Its implied target was 10.42 million. That is a shortfall of 4.45 million barrels a day and the lowest Saudi output in more than three decades.
Global production fell 1.6 million barrels a day from July to 100.1 million. More than 10 million barrels a day of Gulf output is shut in.
Global inventories have drawn 507 million barrels since the conflict began, including 95 million in August alone. Force majeure has been declared by the Qatari, Kuwaiti and Bahraini state companies.
The American statistical agency put August shut-ins at 6.7 million barrels a day. Whichever figure you take, this is lost supply rather than a premium on fear.
Crude flows through the Strait of Hormuz have fallen below two million barrels a day since fighting resumed on 30 August. The week before, they were running at eight to nine million.
Live Market IntelligenceCommodities — Live Market Board
Rio Times · Live Market Intelligence
Commodities — Live Market Board
-0.03%
| Instrument | Last | Change | YoY | Prev. | High | Low | Volume |
|---|---|---|---|---|---|---|---|
| GOLD | 4,461 | +1.78% | +33.20% | 4,383 | 4,503 | 4,421 | 139,824 |
| SILVER | 65.59 | +1.26% | +73.05% | 64.77 | 66.98 | 64.81 | 46,406 |
| BRENT | 88.88 | -0.03% | +34.42% | 88.91 | 90.07 | 88.12 | 29,713 |
| WTI | 83.11 | -0.11% | +31.57% | 83.20 | 84.35 | 82.40 | 166,848 |
| COPPER | 6.61 | +0.03% | +46.70% | 6.61 | 6.71 | 6.61 | 39,543 |
| LITHIUM | 75.20 | +1.47% | +62.95% | 74.11 | 75.80 | 75.08 | 89,275 |
| IRON ORE | 161.91 | — | +58.10% | 161.91 | 161.91 | 1 | |
| SOY | 1,184 | +3.20% | +17.05% | 1,148 | 1,199 | 1,168 | 163,179 |
| CORN | 480.50 | +10.02% | +29.34% | 436.75 | 480.75 | 459.50 | 341,248 |
| WHEAT | 655.00 | +3.93% | +29.70% | 630.25 | 657.75 | 631.50 | 128,793 |
| COFFEE | 317.25 | -5.51% | +0.67% | 335.75 | 321.20 | 313.55 | 21,747 |
| SUGAR | 16.43 | -1.79% | -3.01% | 16.73 | 17.11 | 16.22 | 171,992 |
| COCOA | 5,719 | +3.18% | -34.96% | 5,543 | 5,779 | 5,574 | 26,773 |
| ORANGE JUICE | 138.55 | -0.47% | -45.38% | 139.20 | 141.05 | 137.50 | 703 |
| COTTON | 85.03 | +2.33% | +26.78% | 83.09 | 82.90 | 81.96 | 16,546 |
| BEEF | 223.60 | -3.93% | -5.18% | 232.75 | 226.40 | 223.00 | 16,126 |
| CATTLE | 339.10 | -3.16% | -1.82% | 350.17 | 345.50 | 338.60 | 10,164 |
| USD/BRL | 5.16 | +0.01% | -5.13% | 5.16 | 5.18 | 5.14 | — |
Why Forecasters Are Still Below the Market
Here is the tension in this market. Every major published forecast sits well under Friday’s close.
The American statistical agency has Brent averaging US$91 across 2026 and falling to US$67 in the second half of 2027. Its September outlook was published on the morning of the spike and was stale within a day.
Banks revised upward in the week of 6 September and still landed low. Commerzbank moved its year-end figure to US$85 and HSBC to US$90 for the year.
Bank of America put the second half at US$83. Its own risk case runs to US$120, and an extreme case to US$150 on major infrastructure damage.
Goldman Sachs added five dollars to its December and 2027 numbers. It sees more than US$120 if Gulf output stays four million barrels below pre-war levels.
If the Gulf recovers, it sees the sixties in 2027. The spread between those two cases is the whole uncertainty.
The agency is also forecasting demand down 2.5 million barrels a day this year. So the price is being set by a supply collapse that is outrunning a demand collapse.
The Street thinks this does not last. The Street has been wrong about this war repeatedly since February.
What Happens Next Week
Iran’s foreign minister is due to meet Gulf Arab and Iraqi counterparts in Oman on Monday. The subject is managing traffic through the strait.
That prospect is what knocked oil prices back on Friday. It was profit-taking on diplomacy, not a reversal.
Bahrain has said it will not attend and other attendance is uncertain. Iran conditions any arrangement on the United States lifting its naval blockade.
A previous understanding reached in June collapsed within weeks. Nothing has been signed.
Escalation is running alongside the talks. Houthi forces reached Perim Island in the Bab el-Mandeb on Friday, which puts a second chokepoint in play.
Satellite imagery on Thursday showed smoke near the Saudi pipeline that bypasses the strait. That pipeline is the main workaround.
The producer group met on 6 September and left October quotas unchanged. Its next review is on 4 October.
One analyst noted it now has very limited influence over the physical market. Targets cannot become delivered barrels while the strait is disrupted.
What It Costs Where Our Readers Live
Being a crude exporter is not protection from oil prices. Refining capacity across Latin America has not kept pace with extraction.
So even Brazil and Colombia import refined products. Both absorb pump-price inflation like any importer.
Diesel is the pressure point and it has run far ahead of crude. It traded above US$200 a barrel in early September, 94 percent above pre-war levels.
American retail diesel passed US$6 a gallon for the first time. That is the number that reaches every other price.
In Africa the pass-through has been uneven. Diesel rose 86 percent in Nigeria in local currency over the first half of the year, the steepest on the continent.
It rose more than 50 percent in Tanzania, Ethiopia, Lesotho and Liberia. The African average was about 25 percent against a crude rise near 70.
Nigerian food inflation nearly doubled from 9 to 17 percent between January and May. Transport prices across eighteen African countries ran six points above normal.
About a dozen governments have held prices flat through subsidy. That carries a cost.
Shielding households is estimated to run a median of 0.9 percent of national output a year in developing economies. In the most exposed it reaches 3 percent.
Kenya is the clearest near-term test. Nairobi petrol was 214.03 shillings a litre in August, about US$1.65, and diesel 217.86 shillings or some US$1.68.
A single review in May had already added 46.29 shillings a litre to diesel, roughly US$0.36. Some 5 billion shillings, about US$38.6 million, was drawn from the levy fund to soften it.
The next review falls on 15 September. It is the first direct test of last week’s move on a consumer price anywhere in our coverage.
Egypt has the least room of any country in our coverage. Its gas import bill nearly tripled to US$1.65 billion a month, and its budget for this financial year assumes US$75 a barrel.
It has also cut fuel subsidies from 75 billion pounds to 16 billion. That is a fall from about US$1.46 billion to some US$312 million.
Prices were raised 14 to 17 percent in March under the same reform. There is no cushion left.
Two Winners and One Surprise
Argentina is the clearest beneficiary, with record output of 887,000 barrels a day from Vaca Muerta. Brazil is producing a record 4.24 million barrels a day.
Brazil also has an unusual shock absorber. Its ethanol-capable car fleet held pump-price inflation to about five percent against roughly thirty percent in the United States.
Mexico is the surprise. It exports crude and imports refined products, and the import bill has exceeded the export earnings.
So it is a net loser from oil prices it might be expected to welcome. The refining gap decides it.
Annual inflation across the region in June and July ran from 3.12 percent in Mexico to 33.5 percent in Argentina. Colombia was at 6.14 and Brazil at 4.64.
More: Africa news in English, every day from The Rio Times.
Frequently Asked Questions
What are oil prices now?
Brent settled at US$104.61 on Friday 11 September and West Texas Intermediate at US$100.05. Markets were closed over the weekend.
Why are they so high?
More than 10 million barrels a day of Gulf production is shut in. Saudi Arabia produced 5.97 million barrels a day in August against a target above 10 million.
Is this a risk premium?
No. It is a physical shortfall. Global inventories have drawn 507 million barrels since the conflict began.
Will prices fall?
Every major forecaster expects so. The statistical agency has Brent averaging US$91 this year and US$67 in the second half of 2027.
Who is worst affected?
Import-dependent economies with no fiscal room. Egypt has cut fuel subsidies to about US$312 million and budgeted for US$75 a barrel.
Sources: IEA Oil Market Report September 2026, EIA Short-Term Energy Outlook, Reuters, US Central Command, UKMTO, IFPRI, Center for Global Development, EPRA, Atlantic Council.
This article was produced by The Rio Times’ automated newsroom system. How we use AI · Report an error
Read More from The Rio Times