Wheat Fund Rises 1.4% as Soybeans Slip | Grains Wrap, Nov 19
Wheat and corn funds rose while soybeans slipped on 19 November, a day Wall Street fell 2%, as Brazil's planting pace weighs on soy prices.
Key Facts
- Soybeans: The SOYB soybean fund fell 0.55% to US$25.44, its second straight loss.
- Corn: The CORN fund gained 1.13% to US$17.07 but is 15.9% below its 1 September peak.
- Wheat: The WEAT wheat fund rose 1.37% to US$21.47, yet is 23.3% under its 28 August high.
- Brazil: Conab, Brazil’s crop agency, put soybean planting at 66.8% of the area on 6 November.
- Mood: The S&P 500 fell 2.02% and the VIX jumped 15.80%, yet two of three grain funds rose.
Today’s Focus
Wheat and corn rose on Thursday, 19 November 2026, while soybeans slipped for a second session. The split came on a nervous day, with US shares down 2.02% and the VIX, Wall Street’s fear gauge, up 15.80%.
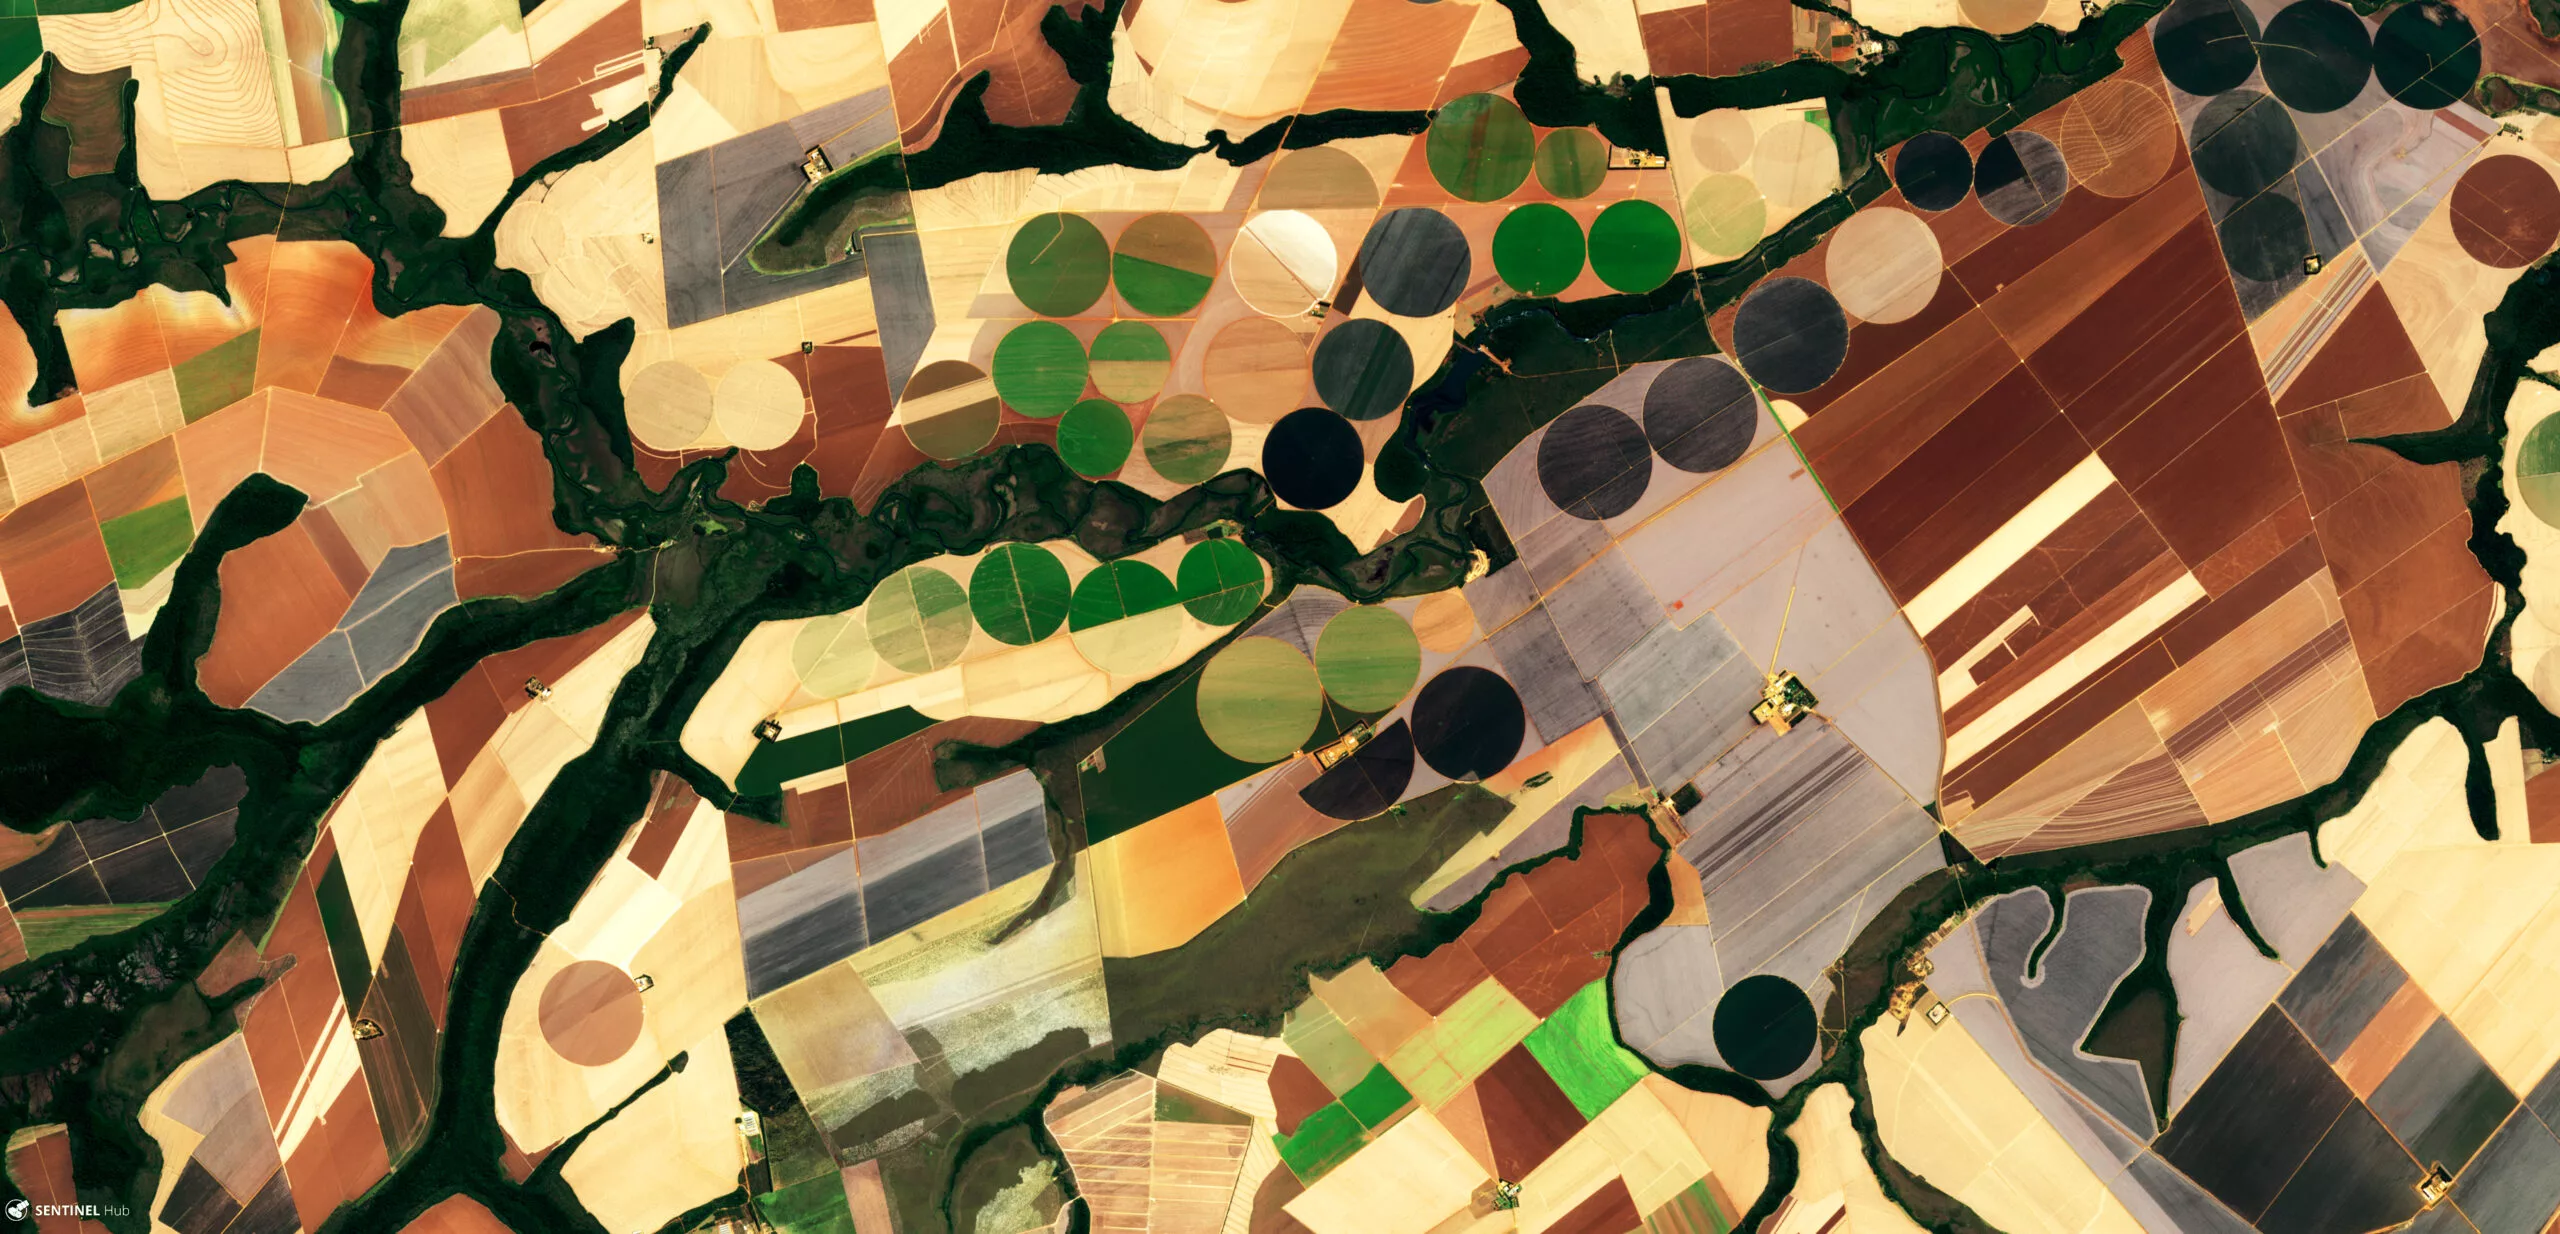
Soybeans are the weakest link because Brazil, the world’s biggest supplier, is planting a large crop quickly. Conab says planting reached 66.8% of the area by 6 November, ahead of the previous week’s pace.
Corn and wheat are bouncing from deep lows rather than starting a recovery. Wheat is down 20.5% over 60 sessions and corn 14.8%, so some of Thursday’s gain looks like bargain-hunting after a long slide.
What matters today. Grain prices are sliding because the Southern Hemisphere harvest looks big, and only stronger export demand, or a weather scare in Brazil, can reverse that.
01 The session in one read
Think of the grain market as a three-lane road where the traffic has slowed for weeks. On Thursday, 19 November 2026, wheat and corn nudged forward while soybeans edged back.
The odd part is the backdrop. Shares fell sharply and fear jumped, yet farm-crop funds mostly rose, which suggests traders were covering earlier bets on falling prices rather than chasing a new theme.
Thursday looks like a pause in a downtrend for corn and wheat, and a continuation of it for soybeans. The fund moves are modest against the weeks of losses that came before them. The variable to watch is Brazil’s planting and weather over the coming weeks, because that decides how large the harvest, and the supply hitting world markets, will be.
02 The board
The soybean-tracking fund, SOYB, closed at US$25.44, the corn fund CORN at US$17.07 and the wheat fund WEAT at US$21.47. These are exchange-traded funds that follow futures prices, not the price of a tonne of grain itself.
Soybeans have fallen two sessions in a row. Corn and wheat each rose for one session after longer declines.
| Asset | Level | Change |
|---|---|---|
| Soybeans (SOYB) | US$25.44 | −0.55% |
| Corn (CORN) | US$17.07 | +1.13% |
| Wheat (WEAT) | US$21.47 | +1.37% |
Source: RT close, 2026-11-19. Where a commodity has no spot feed, an exchange-traded tracker or leading producer is shown as a labelled proxy.
Live Market IntelligenceThe live market board
Rio Times · Live Market Intelligence
Latin America — Cross-Market Board
| Instrument | Last | Change | YoY | Prev. | High | Low | Volume |
|---|---|---|---|---|---|---|---|
| IBOV | 166,376.43 | -0.69% | +7.08% | 167,537.95 | 168,498 | 165,833 | — |
| IPSA | 10,333.80 | -0.28% | — | 10,362.70 | 10,375 | 10,286 | — |
| IPC MEX | 68,891.88 | -0.38% | +10.68% | 69,154.17 | 69,407 | 68,608 | 166,484,958 |
| MERVAL | 2,848,945 | — | — | 2,848,945 | — | — | — |
| COLCAP | 2,452.46 | — | — | — | — | — | — |
| USD/BRL | 5.93 | +0.90% | +11.37% | 5.88 | 5.93 | 5.93 | — |
| EUR/BRL | 6.51 | +2.63% | +6.02% | 6.35 | 6.51 | 6.51 | — |
| USD/MXN | 19.11 | +1.35% | +4.33% | 18.86 | 19.13 | 19.05 | — |
| USD/CLP | 1,015 | +0.73% | +8.96% | 1,008 | 1,015 | 1,015 | — |
| USD/COP | 3,427 | +3.61% | -7.69% | 3,307 | 3,427 | 3,422 | — |
| USD/PEN | 3.45 | +0.37% | +1.98% | 3.43 | 3.45 | 3.45 | — |
| USD/ARS | 1,565 | +0.34% | +11.20% | 1,559 | 1,565 | 1,565 | — |
| USD/UYU | 40.61 | +3.19% | +3.31% | 39.35 | 40.61 | 40.61 | — |
| USD/PYG | 6,212 | +2.85% | -10.37% | 6,040 | 6,212 | 6,212 | — |
| USD/BOB | 11.64 | +3.02% | +72.76% | 11.30 | 11.64 | 11.64 | — |
| USD/DOP | 59.83 | -0.61% | -5.03% | 60.20 | 59.95 | 59.83 | — |
| USD/CRC | 441.73 | +2.49% | -9.50% | 431.01 | 441.73 | 441.73 | — |
| USD/GTQ | 7.64 | +3.23% | +2.03% | 7.40 | 7.64 | 7.64 | — |
03 Why it moved
The first and heaviest cause is supply, mainly in soybeans. Conab’s latest survey projects Brazil’s 2026/27 soybean crop at 181.6 million tonnes on about 49.3 million hectares, a 0.7% increase on the previous season. Mato Grosso, the biggest producing state, had planted 95.6% by 6 November.
The second cause is demand, which is mixed. The US Department of Agriculture’s weekly export sales, carried by the RT economic calendar (USDA units, mostly thousand tonnes), showed net sales of wheat at 344.8 (previous 182.8), corn at 1,588.1 (previous 2,881.4), soybeans at 1,501 (previous 1,154.8), soybean meal at 198.1 (previous 360.9), soybean oil at 0.9 (previous 1.7), pork at 32.1, beef at 7.1 and upland cotton at 118.7. Gross sales were wheat 408.7, corn 1,627, soybeans 1,622.1, pork 36.2, beef 8.8 and upland cotton 128.4. Marketing-year totals were corn 1,630, soybeans 1,501, soybean meal 199.1, wheat 344.8 and soybean oil 0.9, while next-year corn sales were 41.9, soybean meal 1 and soybeans 0.
The third cause is market mechanics. With US shares falling and fear rising, investors often close grain positions to raise cash, and then buy back when the panic eases. The dollar index barely moved at 103.92, up 0.06%, and the 10-year Treasury yield edged down to about 5.0%, so neither explains the split.
Our best reading, with medium confidence, is that corn and wheat benefited from short-covering after steep falls. Soybeans lacked that support because the big Brazilian crop outweighs it.
04 The trend behind it
Over the past year the picture is one of retreat from late-summer highs. Soybeans are 4.9% lower over 60 sessions and sit 17.2% above their 13 January low, so they are the most resilient.
Corn is only 3.6% above its 29 June low of 16.47 after falling 3.99% over 20 sessions. Wheat has fallen 6.00% over 20 sessions, making this a continuation of the downtrend, not a new phase.
Our own price history since 2011 offers a cautionary note. After soybean falls of this size, in 62 earlier independent cases the fund was higher 20 sessions later in 38 of them, or 61%, with a median gain of 0.7% and a worst loss of 10.1%.
Wheat’s record is weaker: in 76 comparable cases it was higher 20 sessions later only 31 times, or 41%, with a median of minus 0.6% and a worst loss of 23.9%. History is not a forecast.
05 What it means for Latin America
Brazil is both the winner and the pressure point. A large crop brings volume, but lower world prices cut the dollar value of each tonne that farmers, traders and the government earn from exports.
Argentina, the other great exporter of soy products and corn, faces the same price pressure from the Brazilian harvest. Both countries earn their export dollars in these crops, so soft prices tighten the supply of foreign currency that supports the real and the peso.
For importers such as Mexico, which buys large volumes of US corn and wheat, cheaper grain is a relief for food and animal-feed costs.
06 The names to watch
The three funds, SOYB, CORN and WEAT, are the quickest way to follow the market from an ordinary brokerage account. Corn and wheat sit nearer their lows, so they react more sharply to any change in mood.
In Brazil, listed grain handlers and farm-input companies move with crop prices and the real. Investors should watch weekly planting data from Conab, especially Rio Grande do Sul, where only 3% had been planted by 6 November.
07 What would end it
The downtrend would ease if planting slows or weather damages Brazilian fields. The nearest support is the corn fund’s 12-month low of 16.47 and the soybean fund’s 21.71 low; resistance sits at the 28.14 soybean high.
There is no single date that settles it. The weekly Conab planting updates and the next monthly crop survey are the checkpoints, and a calmer stock market would also remove the forced selling that has crept into commodities.
08 What to watch
- Brazil planting: Weekly Conab progress, especially Rio Grande do Sul and Paraná, shows whether the crop stays on schedule.
- USDA export sales: The weekly report shows whether foreign buyers keep taking US wheat, corn and soybeans.
- Risk appetite: A calmer VIX would reduce forced selling in grain funds.
- Support levels: Corn at 16.47 and soybeans at 21.71 are the 12-month lows that traders will defend.
Frequently Asked Questions
Why did soybeans fall while wheat and corn rose?
Soybeans face a large Brazilian crop, whereas corn and wheat, after long declines, attracted buyers closing earlier bets on lower prices.
Why does Brazil matter for grain prices?
It is the world’s largest soybean exporter, and Conab projects 181.6 million tonnes for 2026/27, so its harvest sets the global supply.
What role does China play?
China is the main buyer of Brazilian soybeans, which is why Chinese demand matters for prices; we could not confirm October shipment figures.
Are SOYB, CORN and WEAT the grain prices themselves?
No. They are funds that track futures, so their prices differ from the cost of a tonne of grain.
Market data: The Rio Times
This article was produced by The Rio Times’ automated AI newsroom. Editorial responsibility: Matthias Camenzind, Publisher and Editor-in-Chief. The Rio Times also runs Ask Rio Times, which answers from 100,000+ of our own articles, the daily Latin America Power Map, and prediction-market odds on elections and markets.. How we use AI · Report an error
LatAm Markets: Live Signals → — real-time movers, turnover leaders and FX across Latin America.