Key Facts
- Wheat: The WEAT fund fell 1.10% to US$21.62, 22.8% below its 28 August peak.
- Soybeans: The SOYB fund fell 0.77% to US$25.77 after gaining 2.18% over five sessions.
- Corn: The CORN fund rose 0.12% to US$17.20, its second gain in a row.
- Dollar: The US dollar index rose to 103.63, up 1.94% in five sessions, making US grain dearer abroad.
- Brazil: CONAB, Brazil’s crop agency, forecasts a record 181.6 million tonnes of soybeans for 2026/27.
- Prediction markets: Polymarket, a real-money prediction market, prices a 0.25-point Federal Reserve rate rise in December at 91.5% (US$35.7 million traded, 9:10 p.m. ET, 16 November).
Today’s Focus
Grain prices drifted in different directions on Monday, 16 November 2026, but the common thread was supply. Wheat fell furthest of the three funds, and a stronger dollar made American grain pricier abroad.
Soybeans gave back a little after a good week, while corn nudged higher. The trackers we follow are exchange-traded funds that mirror the crops, not the crops’ own prices.
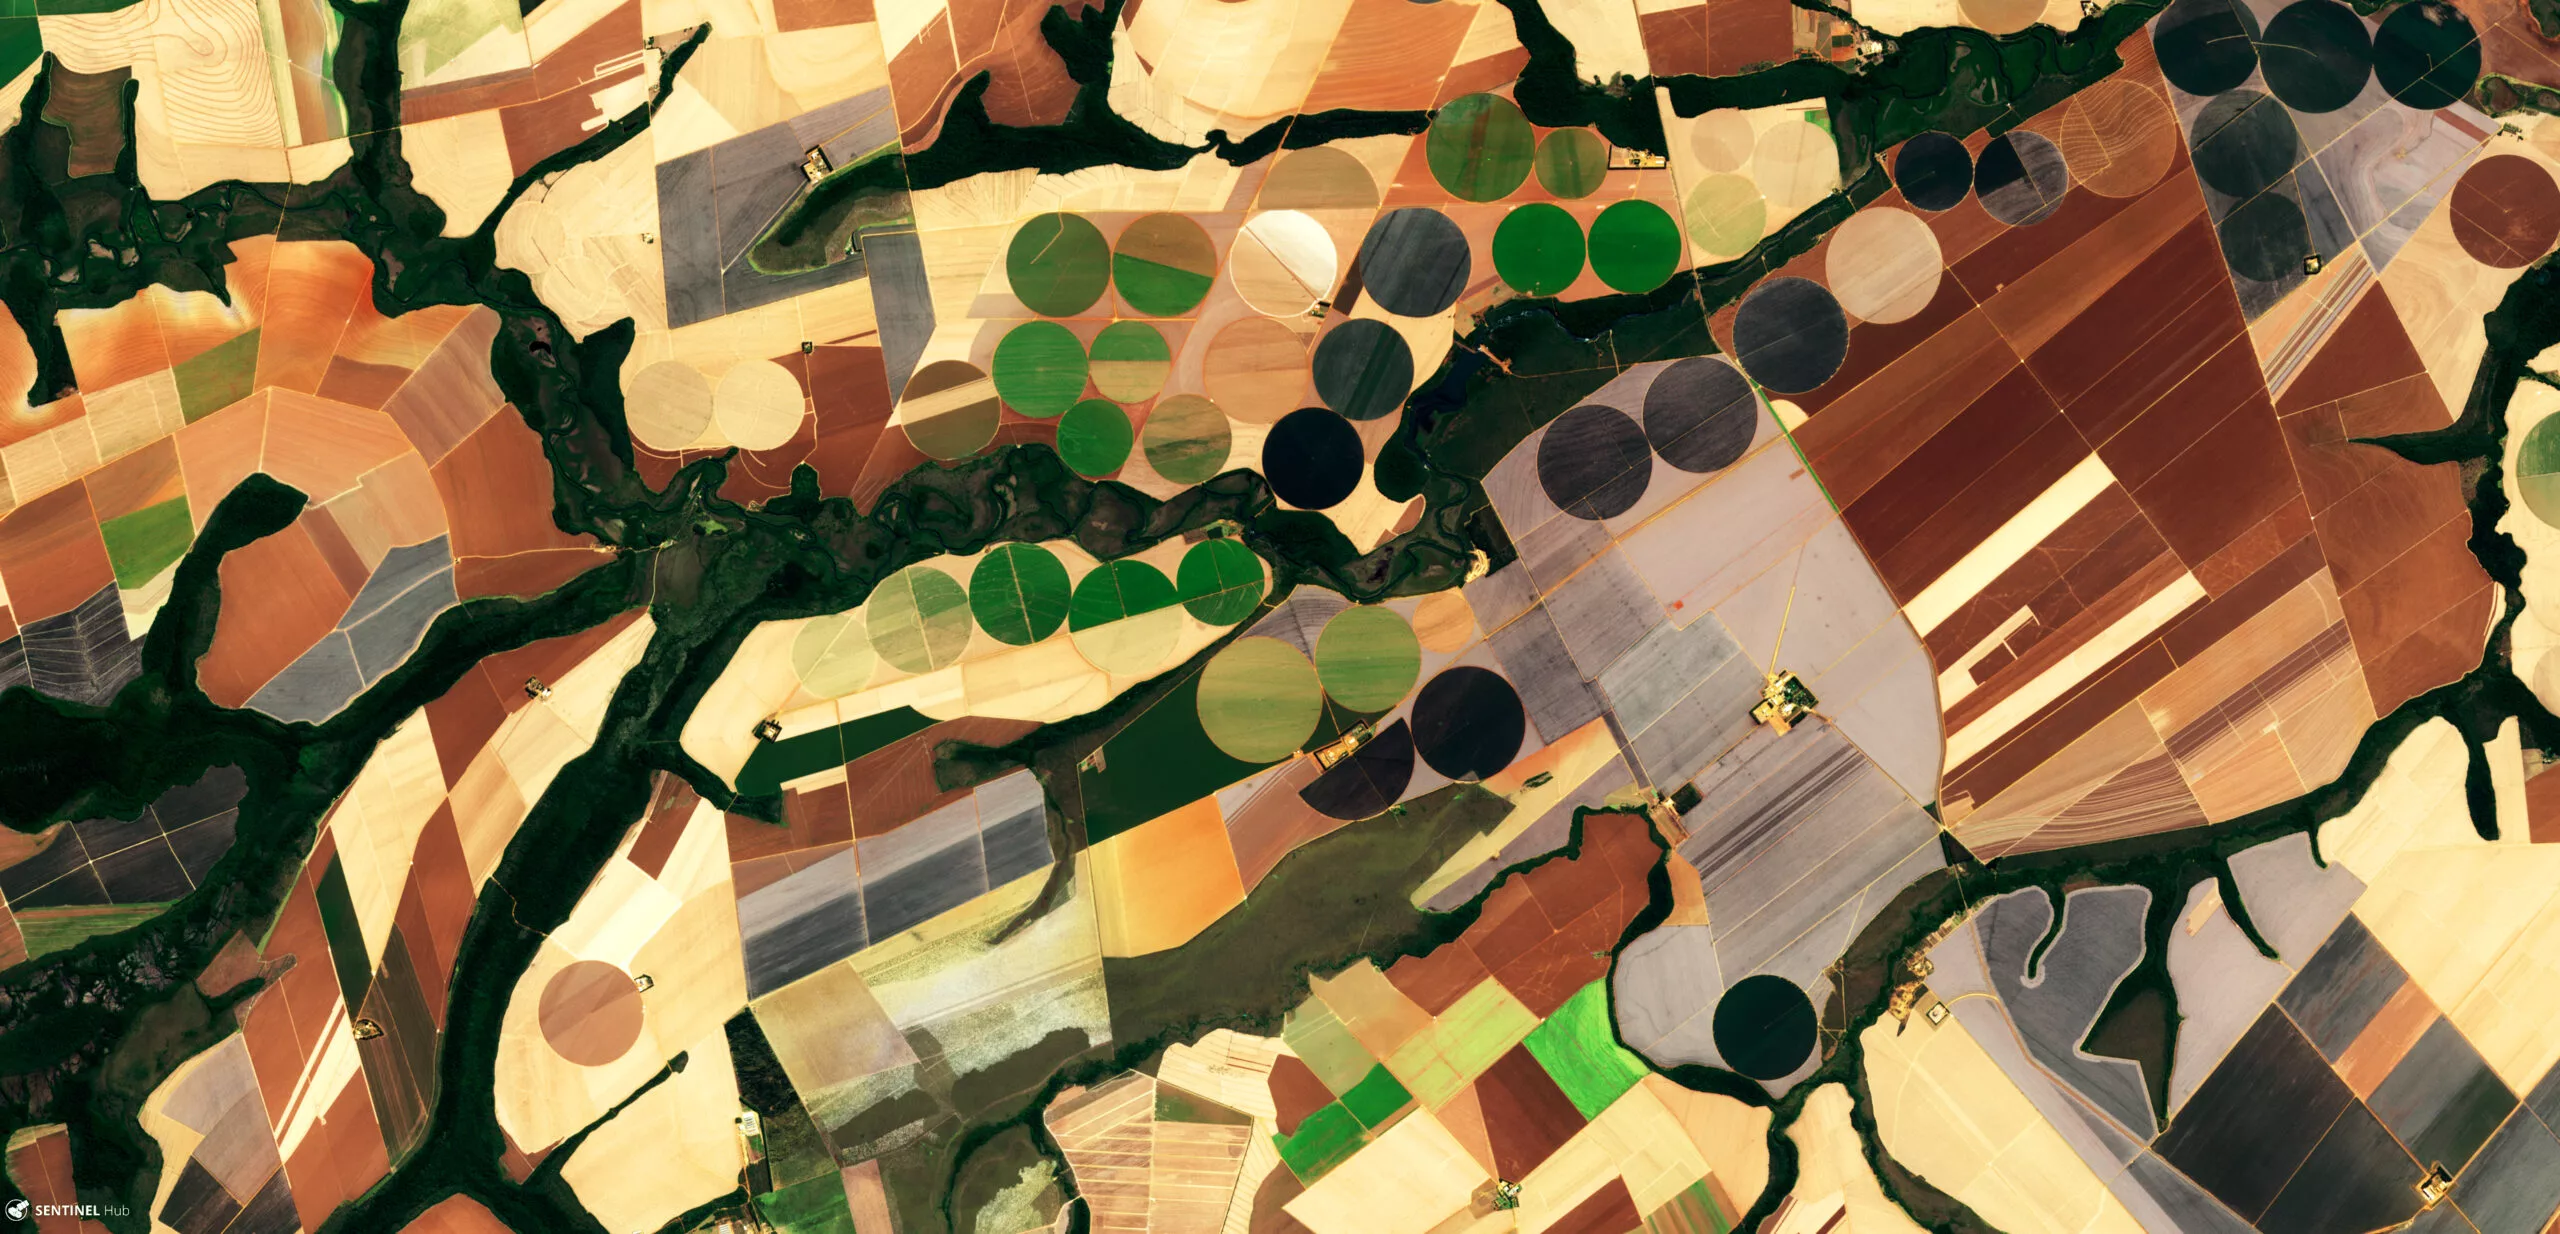
Behind the day-to-day wobble sits the real story: Brazil, the world’s biggest soybean exporter, is planting what its crop agency expects to be a record harvest. Argentina, the other big South American exporter, adds to the supply picture.
What matters today. A firm dollar and a record Brazilian soybean forecast are weighing on grain prices, and only a weather scare or a burst of export demand is likely to change that.
01 The session in one read
Think of the grain market as three shops on one street, and on Monday only one of them had customers. Corn edged up, soybeans slipped and wheat sold off.
The common cause was a stronger dollar meeting a heavy supply picture. When the dollar rises, buyers paid in other currencies must spend more of their own money for the same bushel, so they tend to buy less.
The weight of evidence points to a market with more grain than it needs: Brazil is forecast to harvest a record soybean crop and the dollar is firm. Strong US demand for soybeans kept them steadier than wheat, but a firm dollar caps rallies. The variable to watch is the dollar index, because a retreat from 103.63 would be the quickest relief for grain prices.
02 The board
Wheat took the biggest knock: the wheat fund WEAT finished at US$21.62, -1.10%.
Soybeans, via the SOYB fund at US$25.77, fell -0.77% after their recent bounce. Corn, tracked by the CORN fund at US$17.20, rose +0.12%, a tiny gain that still marked a second rise in a row.
| Asset | Level | Change |
|---|---|---|
| Soybeans (SOYB) | US$25.77 | -0.77% |
| Corn (CORN) | US$17.20 | +0.12% |
| Wheat (WEAT) | US$21.62 | -1.10% |
Source: RT close, 2026-11-16. Where a commodity has no spot feed, an exchange-traded tracker or leading producer is shown as a labelled proxy.
Live Market IntelligenceThe live market board
Rio Times · Live Market Intelligence
Latin America — Cross-Market Board
| Instrument | Last | Change | YoY | Prev. | High | Low | Volume |
|---|---|---|---|---|---|---|---|
| IBOV | 169,295.41 | -1.83% | +7.84% | 172,457.76 | — | — | — |
| IPSA | 10,525.26 | -1.27% | — | 10,660.26 | 10,698 | 10,499 | — |
| IPC MEX | 71,204.98 | -0.84% | +13.87% | 71,811.20 | 71,981 | 71,044 | 149,701,210 |
| MERVAL | 2,848,945 | — | — | 2,848,945 | — | — | — |
| COLCAP | 2,452.46 | -0.02% | — | — | — | — | — |
| USD/BRL | 5.78 | +2.05% | +9.22% | 5.67 | 5.79 | 5.78 | — |
| EUR/BRL | 6.36 | +1.74% | +3.67% | 6.25 | 6.37 | 6.35 | — |
| USD/MXN | 18.51 | +0.01% | +1.12% | 18.51 | 18.52 | 18.50 | — |
| USD/CLP | 997.53 | +0.27% | +8.63% | 994.88 | 997.53 | 997.53 | — |
| USD/COP | 3,319 | +0.51% | -10.32% | 3,303 | 3,319 | 3,319 | — |
| USD/PEN | 3.41 | +0.10% | +3.18% | 3.40 | 3.41 | 3.40 | — |
| USD/ARS | 1,550 | +0.37% | +10.11% | 1,544 | 1,550 | 1,550 | — |
| USD/UYU | 40.61 | +0.05% | +3.47% | 40.59 | 40.61 | 40.61 | — |
| USD/PYG | 6,186 | -0.16% | -10.74% | 6,196 | 6,186 | 6,186 | — |
| USD/BOB | 11.59 | +0.00% | +72.10% | 11.59 | 11.59 | 11.59 | — |
| USD/DOP | 60.36 | -0.38% | -5.22% | 60.59 | 60.36 | 60.32 | — |
| USD/CRC | 442.56 | -0.04% | -9.48% | 442.74 | 442.56 | 442.56 | — |
| USD/GTQ | 7.64 | -0.05% | +2.01% | 7.64 | 7.64 | 7.64 | — |
03 Why it moved
First and heaviest, the dollar and a nervous market: wheat fell 1.10% while the dollar index and US bond yields rose. Confidence: medium-high.
Second, the dollar in detail. The dollar index rose 0.21% on the day and 2.00% over five sessions to 103.63, while the ten-year US Treasury yield sits at 5.14%, up 24 basis points in five sessions. A basis point is one hundredth of a percentage point, and higher yields attract money into the dollar. Confidence: medium-high.
Third, a nervous wider market. The S&P 500 fell 1.92% and the VIX, Wall Street’s fear gauge, jumped 18.70% to 22.91, while the oil fund USO dropped 3.81%. Investors were de-risking, which usually hurts commodity funds, though corn’s small gain shows grains were not sold indiscriminately. Confidence: medium.
One signal runs against the grain: US demand for soybeans looks strong. The National Oilseed Processors Association (NOPA), the soy crushers’ trade group, reported a record October crush of 234.2 million bushels against a consensus of 228.8 million and 196.3 million a month earlier, and soybean oil stocks of 1.171 billion pounds against 1.089 billion expected (RT economic calendar). That explains why soybeans held up better than wheat, but it was not enough to lift them against the dollar. Weekly USDA export inspections were mixed (thousand tonnes, week to 12 November): USDA soybean export inspections 1,708.296 against 1,914.145 the week before, USDA wheat export inspections 391.515 against 275.036 and USDA corn export inspections 865.503 against 908.378.
04 The trend behind it
The soybean fund is 8.4% below its 12-month high of 28.14 on 10 September 2026 and 18.7% above its January low of 21.71. It is down 3.77% over 20 sessions, so the recent pattern is a gentle slide with short rallies.
Corn is the longer sufferer, 9.5% lower over 60 sessions, and sits just 4.4% above its 12-month low of 16.47 set on 29 June. Wheat is down 9.46% over 20 sessions and 14.9% over 60.
This looks like a continuation of the post-summer retreat rather than a new phase. The 5 November to 16 November window has brought no change in the basic story of ample supply.
History offers no strong steer. Corn had fallen 4.5% in 20 sessions; in 83 earlier cases of a fall that large in our own records since 2010, it was higher 20 sessions later 42 times (51%), with a median of +0.2% and a worst case of -12.2%. Wheat fell 9.5% in 20 sessions; across 36 such cases since 2011 it was higher 18 times (50%), median +0.3%, worst -23.9%. That is history, not a forecast.
05 What it means for Latin America
Brazil is the centre of gravity. CONAB expects a record 181.6 million tonnes of soybeans in 2026/27,.
A bigger crop means more volume to sell but softer prices, so farmers in Mato Grosso and exporters such as traders paid in dollars feel the squeeze, while the real-denominated costs of fertiliser and diesel stay fixed. A stronger dollar helps by lifting the real value of their dollar sales.
Argentina, the world’s leading exporter of soybean meal and oil, faces the same price pressure, and its state budget leans heavily on grain export taxes. Importers such as Mexico, a big buyer of American corn, and Peru benefit from lower feed and flour costs.
06 The names to watch
The three funds are the quick read: SOYB for soybeans, CORN for corn and WEAT for wheat. They track futures contracts, so they can drift from the crop’s own price.
07 What would end it
The nearest ceiling for soybeans is the 28.14 peak of 10 September, and the floor is the January low of 21.71. For corn, 16.47 is the line that has held since June, and for wheat the 28.00 peak of 28 August is the distant ceiling.
The catalysts are the USDA’s next monthly supply report in December, CONAB’s planting and crop updates, and any move in the dollar. A weather problem in Brazil or a fresh burst of export demand would be the clearest reversal.
Does it stop? Not on current evidence: with a record crop being planted, prices are more likely to stay heavy than to surge, though history shows rebounds are about as common as further falls.
08 What to watch
- The dollar: The dollar index at 103.63 is the most direct pressure on grain prices; a fall would help exporters.
- Brazil’s crop: CONAB’s next crop update will show whether the record forecast holds.
- US demand: The next NOPA crush figures and weekly USDA export inspections will show whether strong soybean demand lasts.
- USDA December report: The next supply update could change the supply picture for all three grains.
What Prediction Markets Say
Polymarket, where users bet real money, lists a market on the Federal Reserve’s December decision, with US$35.7 million traded as of 9:10 p.m. ET, 16 November 2026. It prices a 0.25-point rise at 91.5%, a 0.5-point or larger rise at 4.7%, no change at 3.2%, a 0.25-point cut at 0.4% and a 0.5-point or larger cut at 0.2%.
These prices are bets, not polls. They show traders expect the Fed, the US central bank, to raise interest rates again in December, which would keep the dollar firm and make US grain dearer for foreign buyers.
Why we show this: prediction markets turn real-money bets into a live probability that moves within minutes of the news, which is why investors, campaigns and newsrooms in the United States now follow them closely. We show them next to polls and official results, never instead of them.
Frequently Asked Questions
Why did wheat fall on Monday?
The dollar firmed, so buyers abroad found American wheat dearer, and the wheat fund fell 1.10%.
Why does Brazil matter for grain prices?
Brazil is the world’s largest soybean exporter, and CONAB expects a record 181.6 million tonnes in 2026/27, which would add to supply.
Does a strong dollar hurt grain prices?
Yes, because grain is priced in dollars; a stronger dollar makes it more expensive for buyers using other currencies and tends to reduce demand.
Are SOYB, CORN and WEAT the actual crop prices?
No, they are exchange-traded funds that track the crops, so their prices can differ from the underlying futures.
Market data: The Rio Times
This article was produced by The Rio Times’ automated AI newsroom. Editorial responsibility: Matthias Camenzind, Publisher and Editor-in-Chief. The Rio Times also runs Ask Rio Times, which answers from 100,000+ of our own articles, the daily Latin America Power Map, and prediction-market odds on elections and markets.. How we use AI · Report an error
LatAm Markets: Live Signals → — real-time movers, turnover leaders and FX across Latin America.