Key Facts
- Silver is still far from its peak: it closed Friday, November 6, 2026 at US$51.90 an ounce an ounce (+0.34%), which is 54.7% below its 114.59 high of 28 January.
- Gold lost ground: it settled at US$4,066 an ounce an ounce (-0.49%) after a stronger dollar made it dearer for buyers using other currencies.
- The dollar was the culprit: the US dollar index rose 0.74% to 102.30, and the 10-year Treasury yield, the interest on US government loans, rose 3 basis points to 4.87%.
- The week was still a rebound: gold gained 4.92% over five sessions and silver 5.77%, both bouncing from lows set on 30 October.
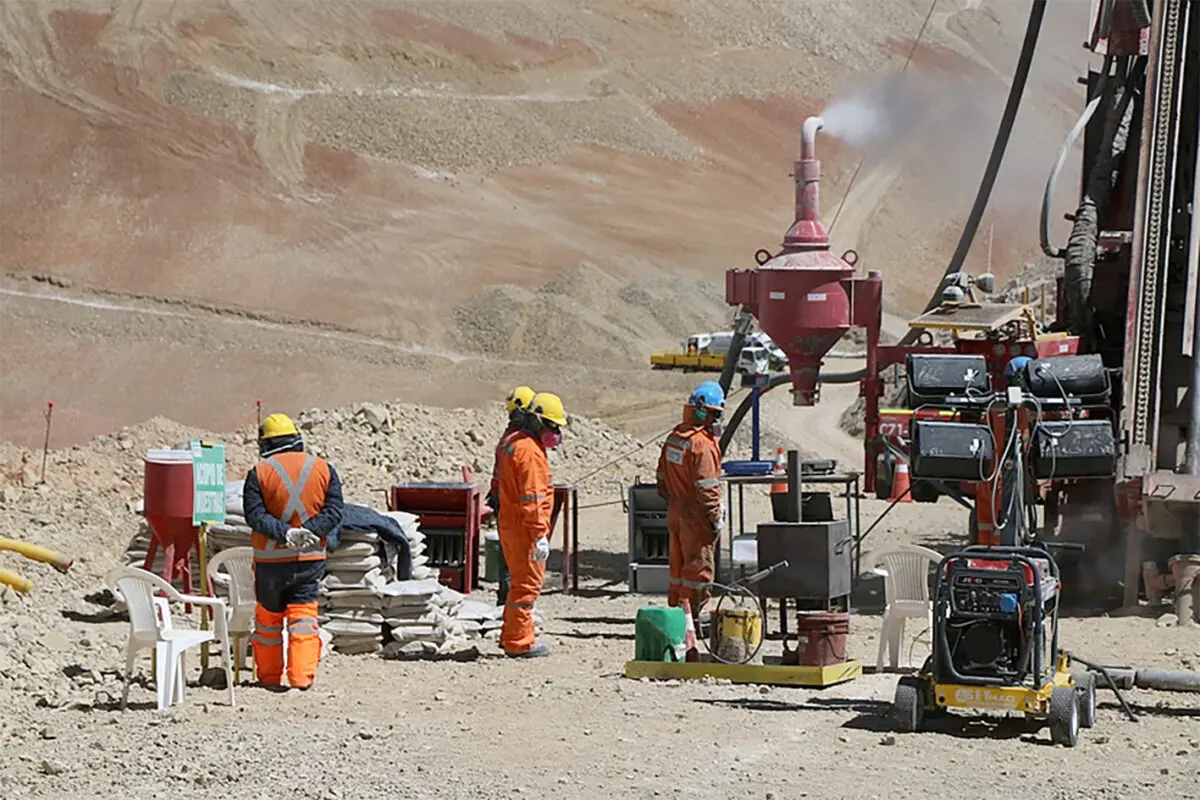
- Latin America sits at the centre: Mexico mined about 172.9 million ounces of silver in 2025, roughly a fifth of world supply, and Peru about 130.6 million.
- History offers a mild comfort: after 19 earlier falls as steep as silver’s recent 20-session slide, the metal was higher 20 sessions later in 14 cases.
Today’s Focus
Gold slipped and silver edged up on Friday, November 6, 2026, the last day of a week that had begun with a sharp rally. A firmer dollar, the main brake on both metals, did most of the damage.
Both metals still sit well below their January highs. Gold, at US$4,066 an ounce an ounce, is 26.2% below its 12-month peak of 5,513, while silver is more than half off its own.
For Latin America this matters directly: Mexico and Peru are the world’s two largest silver producers, so the metal’s swings feed into mining profits, tax receipts and export earnings.
What matters today. A rebound off the 30 October lows is intact, but only a softer dollar and lower US yields can turn it into a new uptrend.
01 The session in one read
Gold moved -0.49% on Friday, November 6, 2026, while silver moved +0.34%. The split is telling: gold is a pure store of value, while silver also goes into solar panels and electronics.
The dollar did the damage. It rose 0.74% on the day, and a pricier dollar makes metals quoted in dollars more expensive for buyers in euros, pesos or rupees.
Both metals bounced from their 30 October lows, yet Friday showed how easily a stronger dollar and higher yields can cap that recovery. Silver is the more fragile of the two, having lost 14.68% over 20 sessions, but our own history says such drops usually heal; the variable to watch is the next US inflation report and what it does to the dollar.
02 The board
Gold ended a one-session losing streak at US$4,066 an ounce, and the gold-tracking fund GLD fell 0.79% to 372.52. Silver, at US$51.90 an ounce, posted its first gain after a dip.
Neither move was large. The week mattered more: gold rose 4.92% over five sessions and silver 5.77%, a recovery from the 30 October lows.
| Asset | Level | Change |
|---|---|---|
| Gold | US$4,066/oz | -0.49% |
| Silver | US$51.90/oz | +0.34% |
Source: RT close, 2026-11-06. Where a commodity has no spot feed, an exchange-traded tracker or leading producer is shown as a labelled proxy.
Live Market IntelligenceThe live market board
Rio Times · Live Market Intelligence
Latin America — Cross-Market Board
| Instrument | Last | Change | YoY | Prev. | High | Low | Volume |
|---|---|---|---|---|---|---|---|
| IBOV | 172,301.21 | +0.56% | +9.18% | 171,336.99 | 172,987 | 171,335 | — |
| IPSA | 10,552.02 | -0.43% | — | 10,597.06 | 10,650 | 10,506 | — |
| IPC MEX | 71,905.78 | +0.05% | +11.98% | 71,866.30 | 72,937 | 71,868 | 125,656,016 |
| MERVAL | 2,848,945 | — | -10.97% | 2,859,051 | — | — | — |
| COLCAP | 2,483.24 | -1.77% | — | — | — | — | — |
| USD/BRL | 5.57 | -0.32% | +5.19% | 5.58 | 5.59 | 5.55 | — |
| EUR/BRL | 6.17 | -0.13% | +0.98% | 6.18 | 6.24 | 6.16 | — |
| USD/MXN | 18.61 | -0.09% | +1.25% | 18.63 | 18.69 | 18.56 | — |
| USD/CLP | 982.08 | -0.22% | +4.76% | 984.23 | 986.76 | 981.63 | — |
| USD/COP | 3,275 | +0.03% | -12.70% | 3,274 | 3,309 | 3,269 | — |
| USD/PEN | 3.41 | -0.07% | +2.99% | 3.41 | 3.43 | 3.40 | — |
| USD/ARS | 1,544 | -0.11% | +8.73% | 1,546 | 1,551 | 1,544 | — |
| USD/UYU | 40.52 | +3.70% | +3.14% | 39.07 | 40.52 | 40.43 | — |
| USD/PYG | 6,174 | +1.84% | -11.47% | 6,063 | 6,196 | 6,174 | — |
| USD/BOB | 11.63 | +0.92% | +71.91% | 11.52 | 11.68 | 11.63 | — |
| USD/DOP | 60.48 | +0.13% | -5.50% | 60.40 | 61.09 | 60.44 | — |
| USD/CRC | 446.01 | +1.66% | -9.02% | 438.71 | 446.01 | 445.62 | — |
| USD/GTQ | 7.64 | +3.18% | +1.90% | 7.40 | 7.64 | 7.63 | — |
03 Why it moved
First cause, and the heaviest: the dollar. The dollar index rose to 102.30, and the 10-year Treasury yield climbed 3 basis points to 4.87%. Gold pays no interest, so higher yields make it less attractive next to bonds.
Second, fear faded. The VIX, Wall Street’s fear gauge, fell 9.01% to 25.64 while the S&P 500 gained 0.31% to 7,377, so there was less demand for safe havens. Traders were also waiting for the October US jobs report, and the Bank of England had raised interest rates a day earlier, which kept rate worries alive.
The conflicting signal is silver’s small gain despite the stronger dollar. Our best reading, with medium confidence, is that bargain-hunting after its steep October slide outweighed the dollar, helped by silver’s industrial demand. Over five sessions yields actually fell 7 basis points, which explains why the week was still positive.
04 The trend behind it
Gold hit 5,513 on 28 January and is 26.2% below it. It has fallen 7.1% over 60 sessions and 3.09% over 20, and sits 4.9% above its 12-month low of 3,875, set on 30 October.
Silver’s journey is wilder: from 114.59 on 28 January to 49.07 on 30 October, and it is now 5.8% above that low. It has lost 14.68% over 20 sessions and 19.8% over 60.
This looks like a continuation of the post-January slide, with a rebound inside it. A new uptrend would need the metals to hold above their 30 October lows while the dollar stops climbing.
Our own price history since 2007 adds perspective. In the 19 earlier cases when silver fell this far in 20 sessions, it was higher 20 sessions later in 14, or 74%, with a median gain of 5.1%, a worst case of a further 19.9% fall and a best case of a 22.5% rise. History is not a forecast.
05 What it means for Latin America
Mexico was the world’s top silver producer in 2025, with about 172.9 million ounces, roughly a fifth of global supply, according to the 2026 World Silver Survey by Metals Focus for the Silver Institute. Its output fell 5%, the third annual decline in a row, so Mexican miners are leaning on price rather than volume.
Peru ranked second with about 130.6 million ounces, up 7%, and China third with about 112.8 million. The top three together mine more than half of the world’s silver.
Behind the price sits a real shortage: the 2025 market deficit, where demand outran supply, was 40.3 million ounces, the fifth in a row. Metals Focus expects 46.3 million ounces for 2026, which is why silver’s long-term story is better than its recent chart.
For importers there was a second tailwind: the oil-tracking fund USO fell 12.10% over five sessions, easing fuel costs across the region.
06 The names to watch
Fresnillo, Mexico’s largest primary silver miner, and Buenaventura of Peru are the most direct listed plays on silver’s direction. Barrick Mining, one of the world’s largest gold producers, recently reported adjusted profit above expectations on higher gold prices.
The Bank of England’s rate rise is the other name to follow. It shows central banks are still tightening, which keeps pressure on metals that pay no interest.
07 What would end it
The nearest support is the 30 October lows: 3,875 for gold and 49.07 for silver, with the round numbers of 4,000 and 50 just above them. A close below either low would reopen the January slide. The January peaks, 5,513 and 114.59, are far enough away to be irrelevant for now.
The next test is the US consumer price report, which analysts expect to move the dollar, followed by the Federal Reserve’s December meeting. Softer inflation and a weaker dollar would end the pressure; hotter data would extend it.
08 What to watch
- US inflation data: The next consumer price report decides whether the dollar and yields keep rising.
- The dollar index: A move back below 102.30 would ease pressure on both metals.
- Silver at 49.07: The 30 October low is the line that separates a rebound from a fresh slide.
- Mexico and Peru output: Mexico’s third straight annual decline versus Peru’s 7% gain shows who is winning on volume.
Frequently Asked Questions
Why did gold fall on Friday, November 6, 2026?
A stronger dollar and a higher 10-year Treasury yield made gold less attractive; the dollar index rose 0.74% to 102.30.
Why is silver so far below its January high?
It peaked at 114.59 on 28 January and has since lost 54.7% of that value, as a stronger dollar and fading haven demand hit it harder than gold.
Which countries mine the most silver?
Mexico leads with about 172.9 million ounces in 2025, followed by Peru with about 130.6 million and China with about 112.8 million.
Does a fall like this usually continue?
In our own history, silver was higher 20 sessions later in 14 of 19 comparable cases, but that is not a forecast.
Market data: The Rio Times
This article was produced by The Rio Times’ automated AI newsroom. Editorial responsibility: Matthias Camenzind, Publisher and Editor-in-Chief. The Rio Times also runs Ask Rio Times, which answers from 100,000+ of our own articles, the daily Latin America Power Map, and prediction-market odds on elections and markets.. How we use AI · Report an error
LatAm Markets: Live Signals → — real-time movers, turnover leaders and FX across Latin America.