Key Facts
- Copper tracker: CPER rose 0.10% to US$39.95 on Friday.
- Miners mixed: Freeport-McMoRan gained 0.23% to US$72.73; Southern Copper fell 0.39% to US$198.76.
- US jobs beat: US added 162,000 jobs in August, lifting rate-hike bets and pressuring gold.
- China grid spend: State Grid plans US$574 billion spend through 2030, up 40% from last plan.
- Demand drivers: Copper is key for grids, motors, renewables, and data centers.
- The catch: Chile leads supply, but DRC overtook Peru as second-largest producer in 2023.
Today’s Focus
Copper prices stayed flat on Friday, September 4, 2026. A strong US jobs report raised hopes for higher interest rates.
But China’s big push to build more power lines kept demand strong. The futures-tracking CPER fund settled at US$39.95, up 0.10%, while Freeport-McMoRan added 0.23% to US$72.73 and Southern Copper fell 0.39% to US$198.76.
US employers added 162,000 jobs in August. That beat expectations.
Gold prices fell as traders expected tighter policy from the Federal Reserve, the US central bank. Industrial copper stayed relatively steady.
State Grid, the company that runs China’s power network, plans to spend US$574 billion on grid upgrades through 2030. That is a 40% jump from its last five-year plan, and it supports copper demand from the shift toward cleaner energy.
What matters today. The session was a tug-of-war between higher US rate expectations and China’s persistent grid and electrification demand.
01 The session in one read
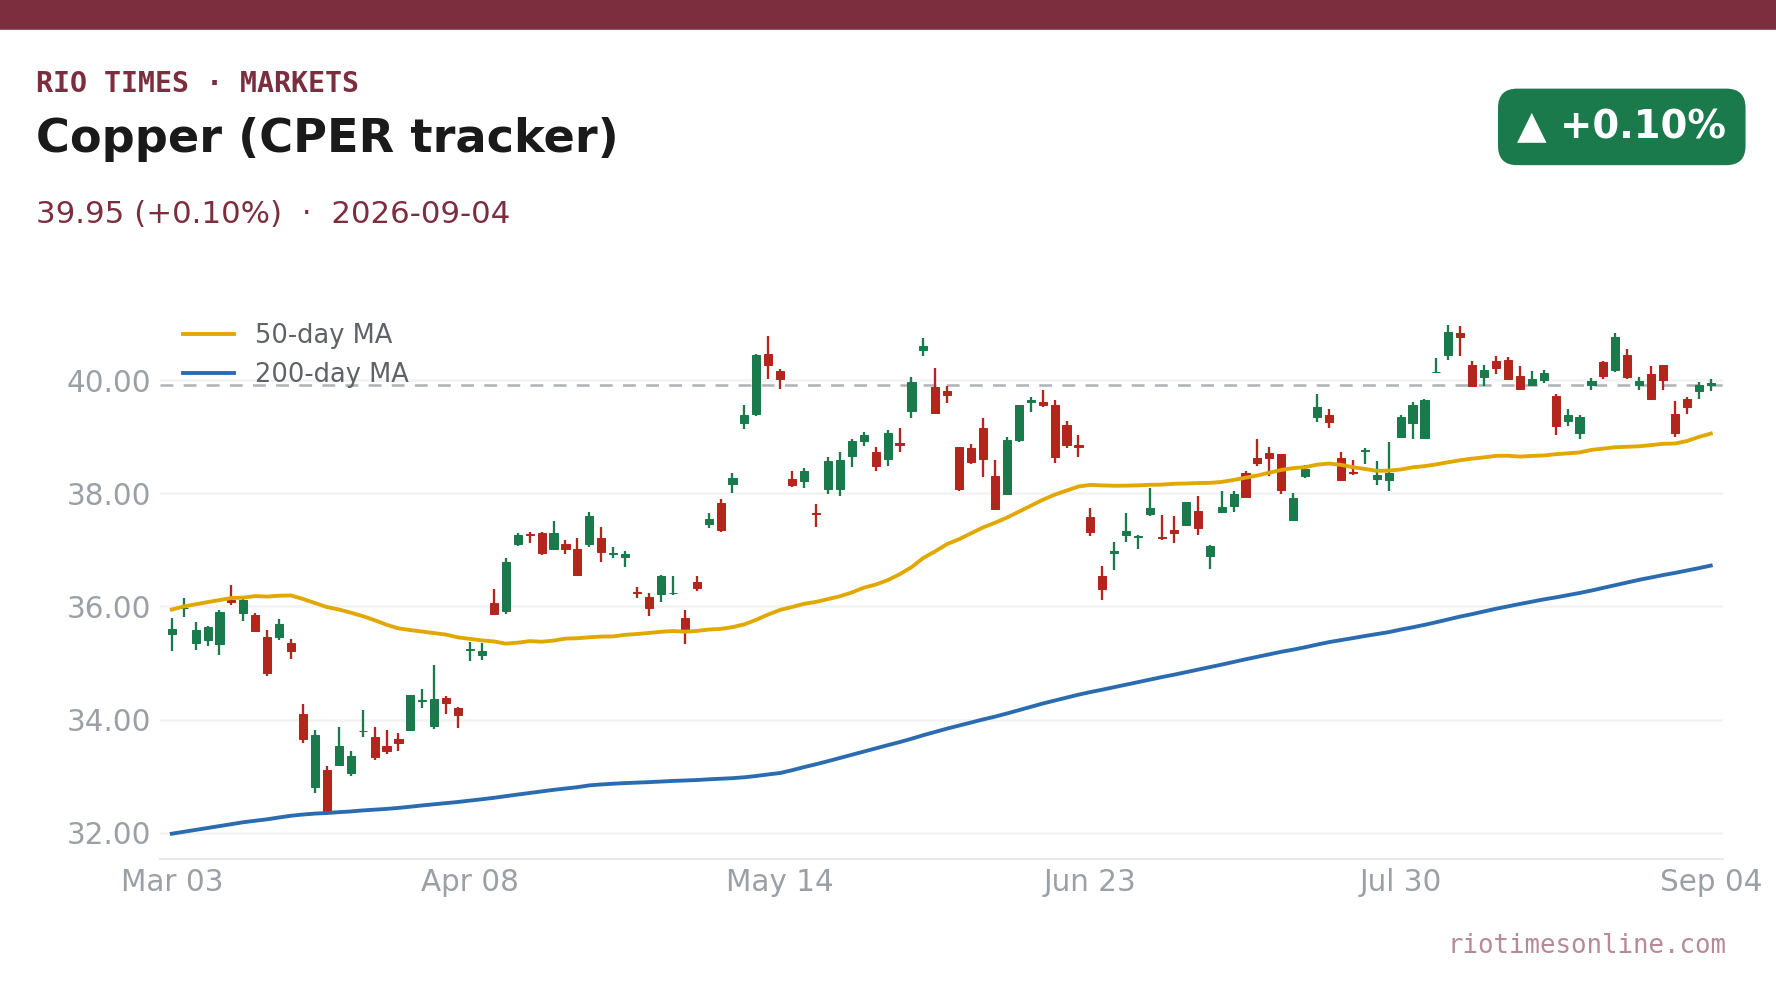
Copper ended Friday, September 4, 2026, with the CPER fund up 0.10% at US$39.95. CPER tracks copper futures.
That small gain hid a two-speed day for mining companies. Freeport-McMoRan rose 0.23% to US$72.73.
Southern Copper slipped 0.39% to US$198.76. A strong US jobs report hurt gold.
But industrial metals were mostly unchanged.
Copper held firm on Friday. Industrial buyers looked past strong US jobs data.
They focused on physical demand. China’s state power grid keeps buying steadily.
Watch the Chinese yuan. If it falls more against the dollar, copper gets costlier for Chinese factories.
02 The board
The CPER fund tracks copper futures, not spot metal. It settled at US$39.95, up 0.10%.
This shows traders did not push copper lower, even with a stronger dollar.
Freeport-McMoRan rose 0.23% to US$72.73. It mines mostly in the US and Indonesia.
Southern Copper fell 0.39% to US$198.76. Its mines are in Peru and Mexico, where prices were softer.
| Asset | Level | Change |
|---|---|---|
| Copper (CPER tracker) | US$39.95 | +0.10% |
| Southern Copper | US$198.76 | -0.39% |
| Freeport-McMoRan | US$72.73 | +0.23% |
Source: RT close, 2026-09-04. Where a commodity has no spot feed, an exchange-traded tracker or leading producer is shown as a labelled proxy.
Live Market IntelligenceThe live market board
Rio Times · Live Market Intelligence
Latin America — Cross-Market Board
| Instrument | Last | Change | YoY | Prev. | High | Low | Volume |
|---|---|---|---|---|---|---|---|
| IBOV | 204,120.12 | -1.15% | +21.85% | 206,495.23 | 168,310 | 167,142 | — |
| IPSA | 10,780.31 | -1.88% | — | 10,987.14 | 11,210 | 10,984 | 1,513,213,483 |
| IPC MEX | 69,889.73 | -0.51% | +12.17% | 70,249.54 | 66,121 | 65,405 | 108,886,187 |
| MERVAL | 3,017,221 | — | +30.51% | 3,022,485 | 3,042,365 | 2,991,150 | — |
| COLCAP | 2,528.42 | -1.25% | — | 9.04 | 9.05 | 9.02 | 4,133 |
| BVL PERÚ | 59,561.23 | -4.26% | — | — | — | — | — |
| USD/BRL | 5.16 | +0.01% | -5.13% | 5.16 | 5.18 | 5.14 | — |
| EUR/BRL | 5.95 | +1.01% | -5.83% | 5.89 | 5.98 | 5.94 | — |
| USD/MXN | 17.06 | -0.24% | -8.58% | 17.10 | 17.08 | 17.01 | — |
| USD/CLP | 913.98 | +0.04% | -5.67% | 913.65 | 915.11 | 906.68 | — |
| USD/COP | 3,140 | +0.03% | -22.04% | 3,139 | 3,141 | 3,105 | — |
| USD/PEN | 3.36 | -0.66% | -4.82% | 3.38 | 3.38 | 3.35 | — |
| USD/ARS | 1,493 | +0.10% | +12.96% | 1,491 | 1,494 | 1,480 | — |
| USD/UYU | 40.27 | +1.24% | +1.80% | 39.77 | 40.27 | 40.23 | — |
| USD/PYG | 5,939 | +1.68% | -19.54% | 5,841 | 5,939 | 5,925 | — |
| USD/BOB | 11.64 | -0.76% | +72.04% | 11.73 | 11.72 | 11.64 | — |
| USD/DOP | 58.34 | +1.25% | -3.44% | 57.62 | 58.34 | 58.04 | — |
| USD/CRC | 445.92 | +0.89% | -9.71% | 441.97 | 448.50 | 445.92 | — |
03 What moved it
Traders pointed to Friday’s US jobs report as the main mover. America added 162,000 jobs in August, more than expected.
That raised bets on another Federal Reserve interest-rate increase, and gold prices fell sharply on that view. Copper handled rate pressure better than gold.
Its demand rests on real-world use. China’s State Grid plans to spend US$574 billion on its network through 2030, a 40% jump from its last five-year plan.
The money goes to power lines, substations, and renewable links, which all need copper. The grid build-out joins electric vehicles, wind, solar, and data centers as big copper users.
Market watchers say this gives copper a price floor even when money gets tighter.
04 The Latin American read
Chile and Peru are the region’s main copper exporters. Chile is the world’s top producer.
Peru was number two until Congo passed it in 2023. Their earnings and royalties matter for the region.
Friday’s mixed miner performance mattered less for national budgets than global demand direction. A firm copper price supports Chilean state revenue through payments from Codelco, the country’s state-owned copper company.
It also supports Peruvian taxes on major miners in the Andean belt. For foreign investors, Southern Copper fell 0.39% to US$198.76.
This reminds us that Peru’s politics and permits can limit share gains. Even when copper prices stay strong, these issues can hold the stock back.
05 The names to watch
Freeport-McMoRan and Southern Copper are the top copper stock gauges. Freeport rose 0.23% to US$72.73.
Investors liked its Grasberg mine expansion in Indonesia. CPER rose 0.10% to US$39.95.
This fund tracks copper futures, so it follows the metal’s price. It avoids the risks of mining companies, like operations, taxes, and permits.
Codelco is Chile’s state copper company. Peru has many big copper mines.
Neither is traded on stock exchanges. But their output and labor talks matter.
They set the supply picture for copper. That shapes the futures curve that CPER follows.
CPER is a copper ETF. It tracks copper futures prices.
06 The outlook
Copper prices may stay in a narrow range for now.
Two forces are pulling against each other.
On one side, the US may keep interest rates higher.
On the other, China keeps spending on power grids and electric systems.
The CPER fund, which tracks copper, moved just 0.10%.
That small move shows investors are not betting on a big price change.
Next, watch China’s monthly activity data.
If construction or power-sector investment speeds up, Freeport-McMoRan and Southern Copper may adjust prices.
07 What to watch
- US dollar index: if the dollar keeps rising on payrolls-driven rate bets.
- China grid spending: State Grid’s US$574 billion plan through 2030 is the single largest source of copper demand. Any change to it moves the metal.
- Chile and Peru supply: mine disruptions.
- Next Fed meeting: if payrolls momentum continues, higher benchmark rates could slow global construction and manufacturing, softening copper demand.
Frequently Asked Questions
What is CPER and what did it do on Friday?
CPER is an exchange-traded fund that follows copper futures. It settled at US$39.95 on Friday, September 4, 2026.
That was up 0.10% from the previous close.
Why did copper hold up while gold fell?
Strong US job numbers made investors think interest rates will rise more. That hurt gold prices.
But copper stayed strong. China needs it for power grids and clean energy, which do not depend much on interest rates.
Who are the big copper miners in the session?
Freeport-McMoRan rose 0.23% to US$72.73 and Southern Copper fell 0.39% to US$198.76, reflecting divergent investor views on operational and country risks.
Why do Chile and Peru matter for copper?
Chile is the world’s largest copper producer. Peru is also a key global supplier.
But the Democratic Republic of Congo passed Peru in 2023. Their output shapes global supply.
Market data: RT
This article was produced by The Rio Times’ automated newsroom system. How we use AI · Report an error · Editorial responsibility: Matthias Camenzind, Editor-in-Chief
LatAm Markets: Live Signals → — real-time movers, turnover leaders and FX across Latin America.