Brazil Markets: Ibovespa & the Real — August 25, 2026
Key Facts
- Ibovespa closed up 0.51% at 171,907 points extending its winning streak as heavyweight miner Vale lent the main support.
- The real weakened modestly with the PTAX venda at 5.1512, down 0.22% from Friday.
- Vale rose 2.80% making the iron-ore exporter the session’s standout driver on the Ibovespa.
- Braskem fell 6.71% after filing for recuperação extrajudicial, an out-of-court restructuring covering about US$10.9 billion of debt. B3 removed the shares from the Ibovespa effective Tuesday.
- The index traded in a wide band from a low of 169,330 to a high of 173,109 before settling near the 171,000 support level.
Today’s Focus
Brazil’s main stock index, the Ibovespa, finished Monday up 0.51% at 171,907 points. That marked a fourth straight daily gain and reflected a session that swung from early losses to a firm close.
The day’s engine was Vale, the mining giant, whose shares jumped 2.80% on supportive commodity sentiment. That strength outweighed a 6.71% drop in Braskem, the petrochemicals group, which slipped after its own restructuring filing.
Brazil’s currency, the real, was little changed at 5.1512 per US dollar on the central bank’s PTAX venda rate, a 0.22% gain for the real. The move was modest and kept the pair in a familiar recent range.
The tone was described locally as volatile and news-driven, with investors balancing corporate stories against a quiet macro backdrop.
What matters today. A resurgent Vale carried the index to a fourth straight gain, but a Braskem slump showed the market is still picking winners rather than rallying broadly.
01 The session in one read
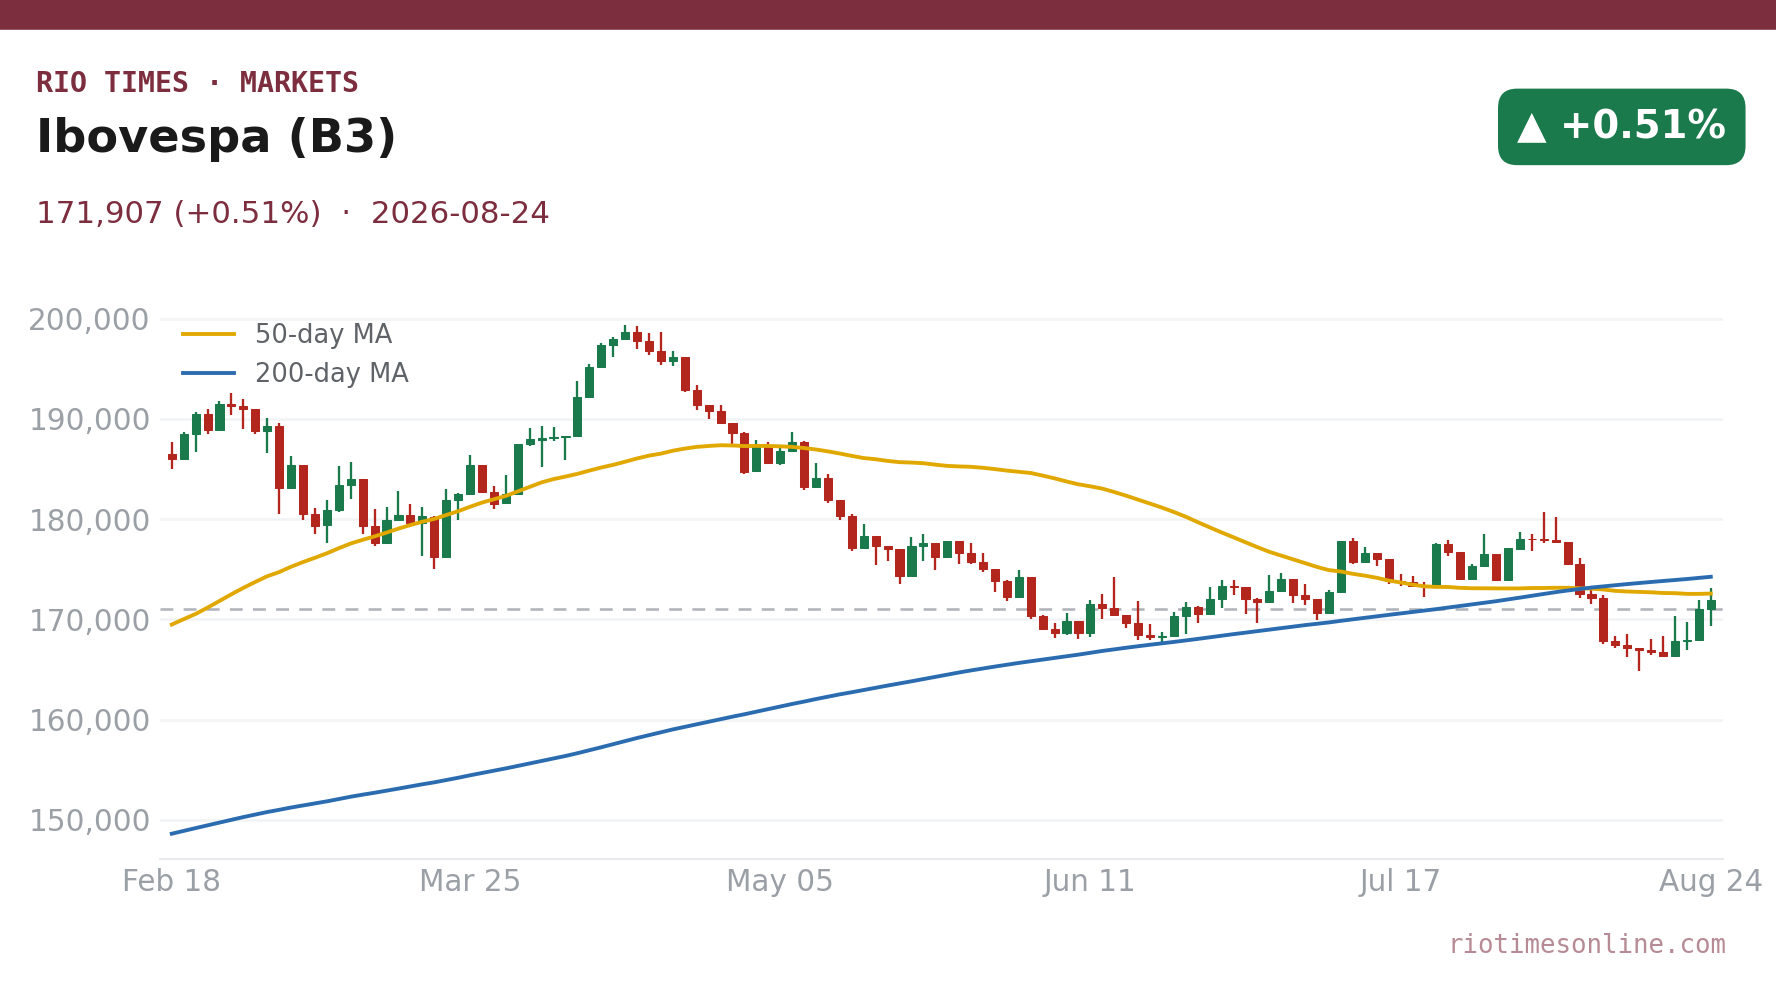
The Ibovespa — Brazil’s main stock index — closed up 0.51% at 171,907 points on Monday, extending its winning streak to four sessions. The move reflected a day that began in the red before corporate news pulled the market higher.
Mining heavyweight Vale provided most of the lift, rising 2.80% and dragging the index along with it. The gain was enough to absorb a 6.71% fall in Braskem, the petrochemical group, which slipped after its own restructuring filing.
Brazil’s currency, the real, finished a shade firmer at 5.1512 per US dollar on the PTAX venda rate, a 0.22% gain. That was a small move by recent standards and kept the exchange rate inside a familiar band.
The local read on the session was one of ‘indefinition’ — investors weighing specific corporate news rather than reacting to any single macro trigger.
The session’s advance looked less like a broad risk-on move than a well-supported story in specific names. Vale delivered almost all the visible upside, while Braskem’s slide revealed how quickly single-stock risk can puncture the tape.
With the real only marginally weaker and US markets mixed, the driver was local and idiosyncratic. The variable to watch is whether Vale’s strength persists beyond one session, because without it the index has little else to lean on.
02 The day’s numbers
| Measure | Level | Change | Read |
|---|---|---|---|
| Ibovespa | 171,907 | +0.51% | Fourth straight gain |
| Session range | 169,330 — 173,109 | — | Wide, volatile band |
| USD/BRL (PTAX venda) | 5.1512 | +0.27% | Real a shade firmer |
| 52-week positioning | 21-22% above year-ago | — | Upper half of range |
| Key technical level | 171,000 points | — | Short-term support held |
The table shows a session that looked choppy on the surface but ended with conviction. The Ibovespa dipped as low as 169,330 before rallying to close above the 171,000 support level that local desks highlighted after Friday’s finish.
The real’s move was barely a rounding error — 0.27% — but it leaned the same way as a slightly stronger US dollar globally. Rio Times · Live Market Intelligence
Live Market IntelligenceBrazil — Live Market Board
Brazil — Live Market Board
Instrument Last Change YoY Prev. High Low Volume
IBOV
207,668.41
+0.70%
+21.85%
206,220.24
168,310
167,142
—
USD/BRL
5.16
+0.01%
-5.13%
5.16
5.18
5.14
—
SELIC
14.00%
—
—
—
—
—
PETR4
41.64
-0.05%
+35.19%
41.66
41.97
41.15
41,499,400
VALE3
72.97
+0.83%
+30.75%
72.37
73.54
72.66
17,658,000
ITUB4
38.60
-1.03%
+4.57%
39.00
39.34
38.39
29,487,800
BBDC4
16.85
+0.36%
+3.50%
16.79
16.90
16.67
19,416,900
BBAS3
19.37
+0.47%
+0.73%
19.28
19.44
19.16
11,069,200
B3SA3
14.26
-0.21%
+12.73%
14.29
14.47
14.11
33,037,800
ABEV3
14.89
-0.80%
+21.91%
15.01
15.07
14.81
16,453,100
WEGE3
47.59
+0.49%
+29.99%
47.36
48.08
47.36
3,364,600
PRIO3
59.14
-0.19%
+50.67%
59.25
59.81
58.74
3,325,600
SUZB3
41.33
+2.35%
-23.55%
40.38
41.48
40.35
3,914,900
RENT3
34.68
-0.09%
+0.84%
34.71
34.96
34.35
7,979,100
AZZA3
15.89
-2.63%
-53.76%
16.32
16.42
15.82
1,330,300
CSNA3
4.30
+0.47%
-42.65%
4.28
4.41
4.26
10,076,100
GGBR4
24.69
+2.19%
+51.38%
24.16
24.85
24.18
7,047,600
ENEV3
24.21
-1.38%
+70.49%
24.55
24.64
23.99
9,297,000
Live Company IntelligenceVale SA ADR — the full investor dossier
Wall Street view
Valuation & profitability
Price & risk
$9.9452-wk high
$17.44
Revenue trend · 6y
Ownership
Dividend
03 Why it moved — Vale’s strength vs Braskem’s slide
Vale, the world’s biggest iron-ore exporter, rose 2.80% and shouldered most of the Ibovespa’s advance. The stock tends to act as a bellwether for global commodity appetite, and Monday’s tone in that market was supportive enough to draw buyers.
Braskem fell 6.71%, a heavy decline for a large listed company. The company itself announced the filing after board approval that morning: recuperação extrajudicial is an out-of-court process for renegotiating debts with creditors before going to a judge.
The result was a tug-of-war: one commodities bellwether rising, one industrial restructuring story falling. The index’s ability to close higher owed almost everything to the Vale side of the ledger.
There was no dominant macro catalyst, leaving investors to trade what was in front of them — corporate headlines and commodity prices.
04 The day’s movers
| Driver | Level / Move | Change | Note |
|---|---|---|---|
| Vale (VALE3) | +2.80% | +2.80% | Iron-ore miner led the index |
| Braskem (BRKM5) | −6.71% | −6.71% | Filed out-of-court restructuring |
| Ibovespa itself | 171,907 | +0.51% | Vale outweighed Braskem |
| Petrobras (PETR4) | -2.31% | -2.31% | Fell with crude; the index’s main drag |
| Itáú (ITUB4) | +0.62% | +0.62% | Banks supported the index |
The movers table is deliberately thin — that is the honest picture. Petrobras was the index’s main drag, falling 2.31% with crude, while Itáú added 0.62% and the banks broadly supported the tape.
Yduqs led the broad board, jumping 12.83% on combination talks with Afya. What is clear is that Vale’s 2.80% rise was the single most important number of the session, and Braskem’s 6.71% fall the biggest drag.
05 The regional scoreboard
| Index | Country | Change |
|---|---|---|
| Ibovespa | Brazil | +0.51% |
| IPC | Mexico | +0.57% |
| S&P IPSA | Chile | +1.76% |
| S&P Merval | Argentina | +2.81% |
| MSCI COLCAP | Colombia | +2.09% |
Latin American equities broadly advanced on Monday, with Argentina’s Merval up 2.81% and Chile’s IPSA rising 1.76%. Brazil’s 0.51% gain sat near the bottom of the regional board but was still positive.
The live market board above carries the verified closes; the key takeaway is that Monday was a risk-friendly day for the region even as US indices wobbled.
06 The technical picture
The Ibovespa held the 171,000-point area that local commentary flagged as short-term support, closing at 171,907. That is constructive for the immediate trend.
The wide intraday range — nearly 3,800 points from low to high — shows there is still twitchiness beneath the surface. A close this far above the low suggests dip buyers are active.
The index sits in the upper half of its 52-week range, roughly 21-22% above where it traded a year ago. The technical question now is whether it can build on 171,000 without another Vale-style boost.
07 What to watch
- Vale’s follow-through: If Vale’s rally fades, the index loses its main engine from Monday
- Braskem restructuring: Further headlines could keep the stock volatile and weigh on the industrial complex
- Real near 5.15: Anything pushing USD/BRL clearly above that level could test local rate-cut bets
- US equity tone: Brazil has diverged from a wobbly US tape; sustained weakness there would raise the bar for local gains
Background: Ibovespa Slides for a 9th Straight Session as Citi Drops Brazil’s Real on a Likely Lula Win.
More: Brazil news in English, every day from The Rio Times.
Frequently Asked Questions
What is the Ibovespa?
It is Brazil’s main stock index, tracking the most-traded companies on the B3 exchange in São Paulo.
Why did Vale move the market?
Vale is one of the largest stocks in the Ibovespa — around 1% of the index — so its 2.80% rise had an outsized effect.
What does USD/BRL 5.1512 mean?
It means one US dollar buys 5.1512 reais. A higher number means the real is weaker against the dollar.
Why did Braskem fall?
Braskem’s own filing for recuperação extrajudicial, an out-of-court debt restructuring, drove the 6.71% decline.
This article was produced by The Rio Times’ automated newsroom system. How we use AI · Report an error · Editorial responsibility: Matthias Camenzind, Editor-in-Chief
LatAm Markets: Live Signals → — real-time movers, turnover leaders and FX across Latin America.