IBOV 172,457.76 ▲ 0.66% IPC MEX 71,204.98 ▼ 0.84% MERVAL 2,848,945 — — USD/BRL5.67▲ 0.45% USD/MXN18.52▼ 0.42% USD/CLP994.16▼ 0.13% USD/COP3,302▲ 0.70% USD/PEN3.40▼ 0.16% USD/ARS1,544▼ 0.11% USD/UYU40.59▲ 2.33% USD/PYG6,196▲ 2.33% USD/BOB11.59▼ 0.37% USD/DOP60.59▲ 1.85% USD/CRC442.74▼ 0.10% USD/GTQ7.64▲ 2.06% USD/HNL26.91▲ 2.15% USD/NIO 36.62 — 0.00% USD/VES909.35▼ 0.13% USD/PAB1.00— 0.00% USD/BZD2.00— 0.00% USD/JMD157.69▲ 1.39% USD/TTD6.75▲ 1.58% EUR/BRL6.25▲ 0.93% BRENT 95.84 ▲ 0.02% WTI 88.56 ▼ 0.20% IRON ORE 161.91 — — COPPER 6.09 ▼ 1.50% GOLD 3,886 ▲ 0.03% SILVER 49.12 ▼ 1.70% SOY 1,232 ▲ 0.37% CORN 445.50 ▲ 0.68% WHEAT 593.25 ▲ 1.54% COFFEE 279.25 ▼ 0.34% SUGAR 18.40 ▲ 0.99% ORANGE JUICE 136.85 ▼ 2.91% COTTON 79.02 ▲ 0.44% COCOA 5,123 ▲ 1.13% BEEF 224.80 ▲ 2.70% CATTLE 335.35 ▼ 0.10% LITHIUM 58.76 ▼ 1.13% PETR4 45.30 ▲ 1.34% VALE3 63.50 ▼ 0.70% ITUB4 42.27 ▲ 1.42% BBDC4 14.52 ▲ 1.40% ABEV3 15.79 ▲ 0.25% BBAS3 15.10 ▼ 2.45% B3SA3 14.89 ▲ 0.88% WEGE3 51.31 ▼ 0.66% PRIO3 63.30 — 0.00% SUZB3 54.77 ▼ 2.27% RENT3 30.07 ▲ 1.66% AZZA3 15.91 ▼ 5.86% CSAN3 3.10 ▲ 8.77% RAIZ4 20.00 — 0.00% PCAR3 2.56 ▲ 7.11% GMAT3 4.25 ▲ 10.68% PSSA3 46.41 ▲ 1.02% CVCB3 0.83 ▼ 1.19% POSI3 3.15 ▼ 6.53% SLCE3 18.28 ▼ 0.44% NATU3 5.13 ▼ 3.75% BRKM5 3.02 ▼ 1.63% RANI3 8.18 — 0.00% CSNA3 3.72 ▼ 12.06% IBOV 172,457.76 ▲ 0.66% IPC MEX 71,204.98 ▼ 0.84% MERVAL 2,848,945 — — USD/BRL 5.67 ▲ 0.45% USD/MXN 18.52 ▼ 0.42% USD/CLP 994.16 ▼ 0.13% USD/COP 3,302 ▲ 0.70% USD/PEN 3.40 ▼ 0.16% USD/ARS 1,544 ▼ 0.11% USD/UYU 40.59 ▲ 2.33% USD/PYG 6,196 ▲ 2.33% USD/BOB 11.59 ▼ 0.37% USD/DOP 60.59 ▲ 1.85% USD/CRC 442.74 ▼ 0.10% USD/GTQ 7.64 ▲ 2.06% USD/HNL 26.91 ▲ 2.15% USD/NIO 36.62 — 0.00% USD/VES 909.35 ▼ 0.13% USD/PAB 1.00 — 0.00% USD/BZD 2.00 — 0.00% USD/JMD 157.69 ▲ 1.39% USD/TTD 6.75 ▲ 1.58% EUR/BRL 6.25 ▲ 0.93% BRENT 95.84 ▲ 0.02% WTI 88.56 ▼ 0.20% IRON ORE 161.91 — — COPPER 6.09 ▼ 1.50% GOLD 3,886 ▲ 0.03% SILVER 49.12 ▼ 1.70% SOY 1,232 ▲ 0.37% CORN 445.50 ▲ 0.68% WHEAT 593.25 ▲ 1.54% COFFEE 279.25 ▼ 0.34% SUGAR 18.40 ▲ 0.99% ORANGE JUICE 136.85 ▼ 2.91% COTTON 79.02 ▲ 0.44% COCOA 5,123 ▲ 1.13% BEEF 224.80 ▲ 2.70% CATTLE 335.35 ▼ 0.10% LITHIUM 58.76 ▼ 1.13% PETR4 45.30 ▲ 1.34% VALE3 63.50 ▼ 0.70% ITUB4 42.27 ▲ 1.42% BBDC4 14.52 ▲ 1.40% ABEV3 15.79 ▲ 0.25% BBAS3 15.10 ▼ 2.45% B3SA3 14.89 ▲ 0.88% WEGE3 51.31 ▼ 0.66% PRIO3 63.30 — 0.00% SUZB3 54.77 ▼ 2.27% RENT3 30.07 ▲ 1.66% AZZA3 15.91 ▼ 5.86% CSAN3 3.10 ▲ 8.77% RAIZ4 20.00 — 0.00% PCAR3 2.56 ▲ 7.11% GMAT3 4.25 ▲ 10.68% PSSA3 46.41 ▲ 1.02% CVCB3 0.83 ▼ 1.19% POSI3 3.15 ▼ 6.53% SLCE3 18.28 ▼ 0.44% NATU3 5.13 ▼ 3.75% BRKM5 3.02 ▼ 1.63% RANI3 8.18 — 0.00% CSNA3 3.72 ▼ 12.06%
since 2009
Sunday, November 15, 2026

Business - Brazil Life & Society

Latin America’s Premier Residential Areas

By · · 3 min read

Recent economic fluctuations, including climbing interest rates and inflation, have driven up the cost of home-buying loans in the Latin American housing market.

This increase affects service accessibility and boosts prices in premier neighborhoods.

The fall of Latin American currencies, like the 49.40% fall of the Argentine peso this year, seems to be affecting home prices.

Free daily brief — no card needed
Get every Business - Brazil story in one morning email
We build you a personalized brief around the topics you follow — free for 7 days. Love it? Your first month after that is US$1.

With significant economies, Argentina, Mexico, and Brazil have the costliest neighborhoods. Real estate platforms Properati, Lamudi, and Trovit report on these markets.

They focused on five countries out of the thirteen studied, pinpointing the ten most expensive areas.

The LatAm Brief

One email, every weekday morning. What moved in Latin American markets, politics and expat life.

Yesterday’s subject line: “Exxon gets Guyana approval for a gas project”

The platforms calculated the average price for luxury homes per square meter in 26 affluent areas. They converted these figures to US dollars for the ranking.

The latest report on expensive neighborhoods includes more countries than previous years, showing a broader scope.

The authors underline two factors for this analysis: the sharp financial divides in Latin America and the strong property market that draws investors despite tough economic times.

Allianz observed a 2.7% drop in global household wealth in 2022, the steepest since 2008, with financial assets losing value.

Chile leads the region in financial assets per person, with Brazil, Mexico, Colombia, Peru, and Argentina following.

This wealth encompasses funds in hand, in banks, due from insurance and pensions, and in stocks or investment funds.
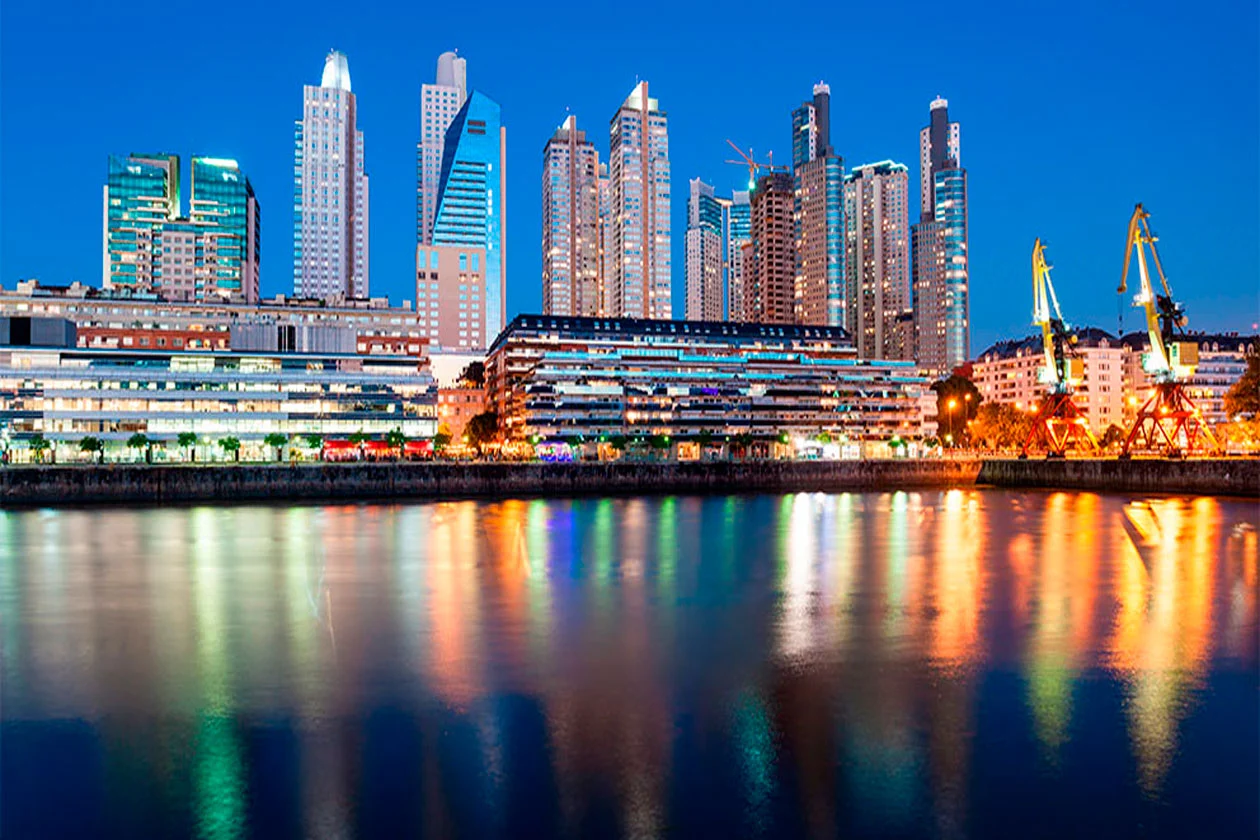
Latin America's Premier Residential Areas.
Latin America’s Premier Residential Areas.
RT
Ask Rio Times
Latin American markets, currencies and companies.
Open the full Ask Rio Times →

Buenos Aires On Top

Habitat for Humanity indicates that over half of those lacking decent housing globally are in unstable informal settlements.

Rapid city growth without risk-ready urban planning is part of the cause.

In this region, most people, about 82%, are city dwellers. Nearly half face housing issues, mostly concerning quality, notes Ernesto Castro from Habitat for Humanity.

At the top of the list for pricey neighborhoods is Puerto Madero in Buenos Aires, where medium-sized apartments go for $5,485 per square meter.

Following are Del Valle in Monterrey at $4,071, Ipanema in Rio at $4,008, Vitacura in Santiago at $3,733, and Carrasco in Montevideo at $3,705.

The list concludes with Vila Nova Conceição in Sao Paulo at $3,393, Tablada Park in Córdoba at $2,845, Savassi in Belo Horizonte at $2,797, Puerta de Hierro in Guadalajara at $2,655, and Bosques de las Lomas in Mexico City at $2,627.

Colombian High-End Locales

The study also shows a surge in Colombian high-end locales, with El Poblado in Medellín rising by 43%, while Chicó in Bogotá and El Prado in Barranquilla saw over a 24% hike.

Increases were also evident in Montevideo, Monterrey, Arequipa, and Guayaquil, with gains between 11% and 23%.

Some districts like La Carolina in Quito and Las Malvinas in Rosario noted a decrease in prices compared to last year, with no area falling more than 8%.

This decreasing trend was seen in other affluent areas, including Vila Nova Conceição, Ipanema, Puerto Madero, Bosques de las Lomas, and Puerta de Hierro.


This article was produced by The Rio Times’ automated AI newsroom. Editorial responsibility: Matthias Camenzind, Publisher and Editor-in-Chief. The Rio Times also runs Ask Rio Times, which answers from 100,000+ of our own articles, the daily Latin America Power Map, and prediction-market odds on elections and markets.. How we use AI · Report an error

The Rio Times · Power Map
See who really holds power in Latin America
Click to open the Power Map →

Brazil runoff date: Sunday, October 25, poll closing times and when results start · Brazil runoff polls: Flávio 51%, Lula 49% · Kalshi and Polymarket odds

Rotate for Best Experience

This report is optimized for landscape viewing. Rotate your phone for the full experience.