Guatemala Foreign Investment Up 7%, US Leads

GUATEMALA · INVESTMENT
Key Facts
- The country Guatemala is the largest economy in Central America, home to about 18 million people and a close trade partner of the United States.
- What happened Foreign direct investment reached US$1,026.9 million in January to June 2026, up 7% from US$959 million a year earlier.
- The top source The United States supplied US$315.7 million, about 31% of the total, ahead of Nicaragua with US$147.4 million and Mexico with US$129.1 million.
- The top sectors Finance and insurance took US$439.2 million, or 42.8%, and commerce and vehicle repair took US$324.1 million, or 31.6%.
- The factory share Manufacturing drew US$156.4 million, about 15% of the total, and US companies put in US$76.7 million of it.
- The year ahead The 2026 projection is US$2,100 million for the full year, against US$1,881 million in 2025.
Guatemala foreign investment reached US$1,026.9 million in January to June 2026, preliminary central bank figures show. Prensa Libre reports that is 7% more than a year earlier, with US companies the top source at US$315.7 million.
Guatemala is the largest economy in Central America, and US firms weighing nearshoring (moving production closer to American customers) watch it closely. The Bank of Guatemala, known as Banguat, shows that most new money went to finance and commerce, not factories.
What the Central Bank Reported
Banguat counts Guatemala foreign investment as the net money that foreign owners put into companies in the country. The total for January to June 2026 was US$1,026.9 million, up US$67.9 million from US$959 million a year earlier, according to Prensa Libre.
Prensa Libre, a leading Guatemalan daily newspaper, published the data on Thursday 22 October 2026. The tables are marked preliminary, so the final numbers for the half year can still move.
For the full year, Banguat projects US$2,100 million in 2026, after US$1,881 million in 2025, according to Prensa Libre. It sees US$2,275 million in 2027, a year in which Guatemala holds general elections.
Which Countries Lead Guatemala Foreign Investment
The United States ranks first in Guatemala foreign investment with US$315.7 million, about 31% of the total. Nicaragua follows with US$147.4 million, then Mexico with US$129.1 million, the Netherlands with US$118.1 million and Colombia with US$75.7 million.
Central America and the Dominican Republic together supplied US$287.8 million, or about 28%. Nicaragua’s US$147.4 million is part of that regional total, and US$146.8 million of it went to finance and insurance.
Luxembourg added US$69.0 million, Panama US$65.9 million, Spain US$53.5 million and South Korea US$52.8 million. Germany contributed US$22.3 million, Switzerland US$14.1 million and Peru US$5.7 million.
Which Sectors Draw the Money
Finance and insurance took US$439.2 million, or 42.8% of Guatemala foreign investment, the largest share. Commerce and vehicle repair took US$324.1 million, or 31.6%, so the two sectors together account for 74%.
Information and communications drew US$163.8 million and manufacturing US$156.4 million. Transport and storage added US$70.2 million, while construction drew US$5.1 million and agriculture US$1.3 million.
Two sectors recorded negative flows, meaning foreign owners took out more than they put in. Electricity, water and sanitation stood at minus US$168.3 million, with England at minus US$101.6 million and Colombia at minus US$70.3 million.
Where Nearshoring Fits
Manufacturing drew US$156.4 million, about 15% of the total, so factory investment is a modest slice of the inflow. US companies put US$76.7 million into manufacturing, about half of the sector’s total, ahead of South Korea with US$51.7 million.
Mexican companies put US$22.9 million into manufacturing, US$47.1 million into commerce and US$42.6 million into finance. Panama and Switzerland added US$26.8 million and US$26.2 million to manufacturing.
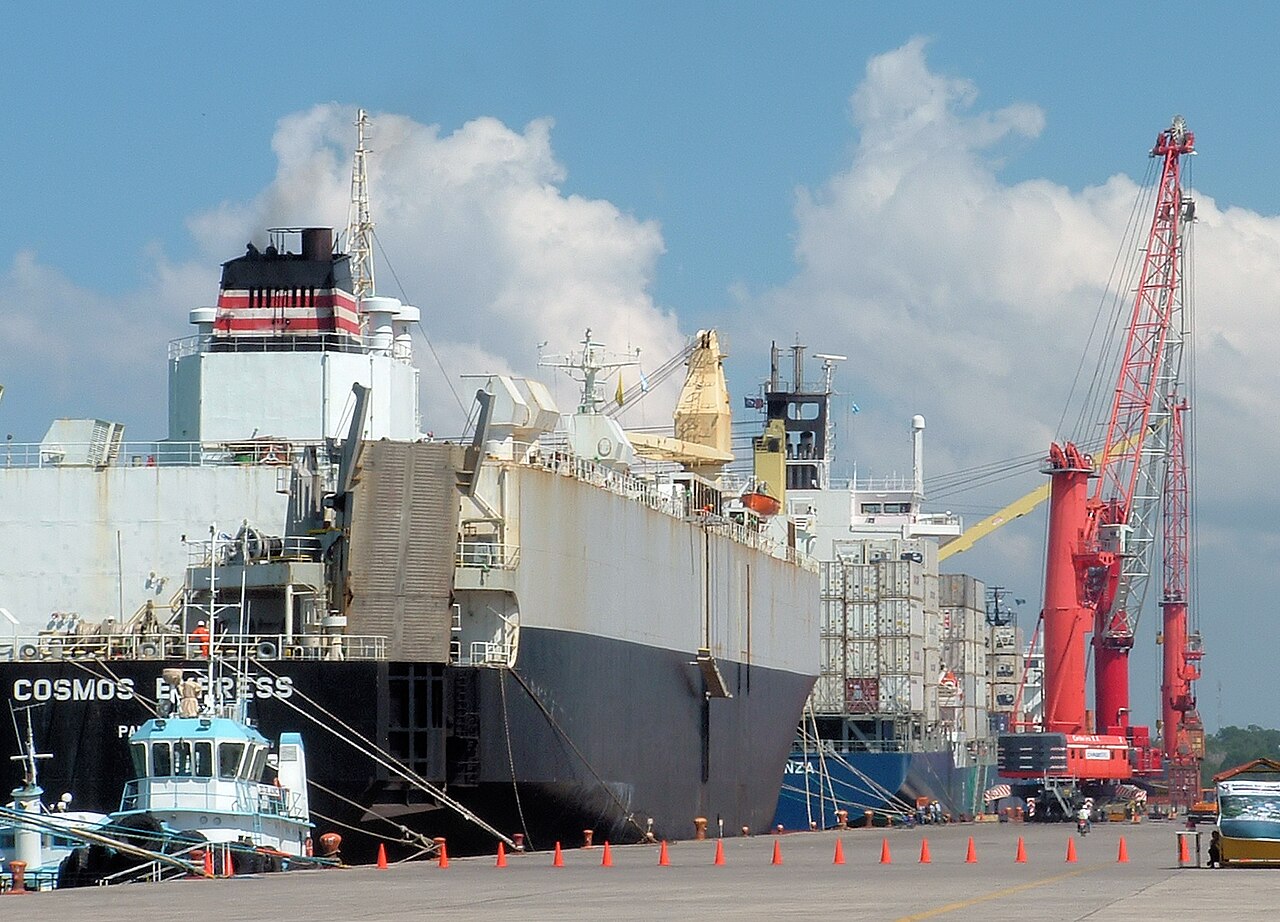
US interest in Guatemalan logistics goes beyond factories. A separate rail plan with US Army engineers targets a freight link from Puerto Quetzal, the main Pacific port.
What It Means for US Readers
The United States is the largest single source of Guatemala foreign investment, with US$315.7 million in six months. Most of it went to commerce, US$122.0 million, and manufacturing, US$76.7 million.
For US manufacturers weighing nearshoring, Guatemala’s factory sector is still small in investment terms, and US firms already lead it. For investors, finance and trade are where Guatemala foreign investment is concentrated.
Banguat’s full-year projection of US$2,100 million, as reported by Prensa Libre, implies about US$1,073 million in the second half. General elections in 2027 give investors a political date to watch.
What Is Not Known
The figures are preliminary, and it is not yet clear how much they will change in the final 2026 data. Why electricity, water and sanitation recorded net outflows of US$168.3 million is not stated in the published tables.
The tables do not show which companies made the largest investments. Whether the second half will reach the projected US$1,073 million remains open.
More: Guatemala news in English, every day from The Rio Times.
Frequently Asked Questions
How much did foreign investment in Guatemala grow in 2026?
Guatemala foreign investment reached US$1,026.9 million in January to June 2026, up 7% from US$959 million a year earlier, according to Prensa Libre. That is an increase of US$67.9 million.
Which countries invest the most in Guatemala?
The United States leads with US$315.7 million, followed by Nicaragua with US$147.4 million, Mexico with US$129.1 million and the Netherlands with US$118.1 million. Central America and the Dominican Republic together contribute US$287.8 million.
Which sectors receive the most Guatemala foreign investment?
Finance and insurance took US$439.2 million and commerce and vehicle repair took US$324.1 million. Together they account for about 74% of the total.
Is Guatemala benefiting from nearshoring?
Manufacturing drew US$156.4 million, about 15% of the total, and US firms contributed US$76.7 million of it. The data do not show how much of that money is tied to nearshoring.
What does Banguat expect for the full year?
Banguat projects US$2,100 million for 2026 and US$2,275 million for 2027, according to Prensa Libre. The 2025 total was US$1,881 million.
What is Banguat?
Banguat is the Bank of Guatemala, the country’s central bank. It publishes the foreign investment tables as part of its balance-of-payments statistics.
Sources: Banco de Guatemala, FDI by origin and industry (tables), 22 October 2026; Banco de Guatemala, FDI to June 2026 (charts), 22 October 2026; Prensa Libre, 22 October 2026.
This article was produced by The Rio Times’ automated newsroom system. How we use AI · Report an error · Editorial responsibility: Matthias Camenzind, Editor-in-Chief