IBOV 183,827.59 ▲ 0.46% IPSA 11,055.91 ▼ 0.73% IPC MEX 65,071.30 ▲ 0.20% MERVAL 2,782,561 ▼ 0.59% COLCAP 2,558.92 ▼ 0.79% BVL PERÚ 60,220.45 ▲ 0.32% USD/BRL5.20▼ 0.43% USD/MXN18.08▲ 0.18% USD/CLP972.08▲ 0.38% USD/COP3,323▲ 0.62% USD/PEN3.44— 0.00% USD/ARS1,524▼ 0.05% USD/UYU40.27▲ 3.67% USD/PYG5,843▲ 2.30% USD/BOB11.96▲ 0.45% USD/DOP59.27▲ 2.75% USD/CRC452.68▲ 2.68% USD/GTQ7.64▲ 3.13% USD/HNL26.87▲ 3.23% USD/NIO36.62▲ 0.34% USD/VES856.92▲ 0.01% USD/PAB1.00— 0.00% USD/BZD2.00— 0.00% USD/JMD 157.28 — 0.00% USD/TTD6.70▲ 1.64% EUR/BRL5.90▲ 0.01% BRENT 88.88 ▼ 0.03% WTI 83.11 ▼ 0.11% IRON ORE 161.91 — — COPPER 6.61 ▲ 0.03% GOLD 4,461 ▲ 1.78% SILVER 65.59 ▲ 1.26% SOY 1,184 ▲ 3.20% CORN 480.50 ▲ 10.02% WHEAT 655.00 ▲ 3.93% COFFEE 317.25 ▼ 5.51% SUGAR 16.43 ▼ 1.79% ORANGE JUICE 138.55 ▼ 0.47% COTTON 85.03 ▲ 2.33% COCOA 5,719 ▲ 3.18% BEEF 223.60 ▼ 3.93% CATTLE 339.10 ▼ 3.16% LITHIUM 75.20 ▲ 1.47% PETR4 41.64 ▼ 0.05% VALE3 72.97 ▲ 0.83% ITUB4 38.60 ▼ 1.03% BBDC4 16.85 ▲ 0.36% ABEV3 14.89 ▼ 0.80% BBAS3 19.37 ▲ 0.47% B3SA3 14.26 ▼ 0.21% WEGE3 47.59 ▲ 0.49% PRIO3 59.14 ▼ 0.19% SUZB3 41.33 ▲ 2.35% RENT3 34.68 ▼ 0.09% AZZA3 15.89 ▼ 2.63% CSAN3 3.22 ▼ 1.83% RAIZ4 0.25 — 0.00% PCAR3 2.75 ▼ 0.36% GMAT3 3.65 ▼ 1.08% PSSA3 48.13 ▼ 0.54% CVCB3 1.33 ▼ 2.92% POSI3 3.36 ▲ 2.44% SLCE3 13.34 ▲ 0.30% NATU3 8.14 ▼ 0.73% IBOV 183,827.59 ▲ 0.46% IPSA 11,055.91 ▼ 0.73% IPC MEX 65,071.30 ▲ 0.20% MERVAL 2,782,561 ▼ 0.59% COLCAP 2,558.92 ▼ 0.79% BVL PERÚ 60,220.45 ▲ 0.32% USD/BRL 5.16 ▲ 0.01% USD/MXN 17.06 ▼ 0.24% USD/CLP 913.98 ▲ 0.04% USD/COP 3,140 ▲ 0.03% USD/PEN 3.36 ▼ 0.66% USD/ARS 1,493 ▲ 0.10% USD/UYU 40.27 ▲ 1.24% USD/PYG 5,939 ▲ 1.68% USD/BOB 11.64 ▼ 0.76% USD/DOP 58.34 ▲ 1.25% USD/CRC 445.92 ▲ 0.89% USD/GTQ 7.62 ▲ 2.21% USD/HNL 26.79 ▲ 1.57% USD/NIO 36.62 ▲ 0.69% USD/VES 762.44 ▼ 0.13% USD/PAB 1.00 — 0.00% USD/BZD 2.00 — 0.00% USD/JMD 157.28 — 0.00% USD/TTD 6.70 ▲ 0.61% EUR/BRL 5.95 ▲ 1.01% BRENT 88.88 ▼ 0.03% WTI 83.11 ▼ 0.11% IRON ORE 161.91 — — COPPER 6.61 ▲ 0.03% GOLD 4,461 ▲ 1.78% SILVER 65.59 ▲ 1.26% SOY 1,184 ▲ 3.20% CORN 480.50 ▲ 10.02% WHEAT 655.00 ▲ 3.93% COFFEE 317.25 ▼ 5.51% SUGAR 16.43 ▼ 1.79% ORANGE JUICE 138.55 ▼ 0.47% COTTON 85.03 ▲ 2.33% COCOA 5,719 ▲ 3.18% BEEF 223.60 ▼ 3.93% CATTLE 339.10 ▼ 3.16% LITHIUM 75.20 ▲ 1.47% PETR4 41.64 ▼ 0.05% VALE3 72.97 ▲ 0.83% ITUB4 38.60 ▼ 1.03% BBDC4 16.85 ▲ 0.36% ABEV3 14.89 ▼ 0.80% BBAS3 19.37 ▲ 0.47% B3SA3 14.26 ▼ 0.21% WEGE3 47.59 ▲ 0.49% PRIO3 59.14 ▼ 0.19% SUZB3 41.33 ▲ 2.35% RENT3 34.68 ▼ 0.09% AZZA3 15.89 ▼ 2.63% CSAN3 3.22 ▼ 1.83% RAIZ4 0.25 — 0.00% PCAR3 2.75 ▼ 0.36% GMAT3 3.65 ▼ 1.08% PSSA3 48.13 ▼ 0.54% CVCB3 1.33 ▼ 2.92% POSI3 3.36 ▲ 2.44% SLCE3 13.34 ▲ 0.30% NATU3 8.14 ▼ 0.73%
since 2009
Wednesday, September 30, 2026

Brazil Politics - Brazil

Economic Powerhouses: Unveiling Brazil’s State-by-State GDP Contributions

By · November 14, 2024 · 2 min read

The LatAm Brief

One email, every weekday morning. What moved in Latin American markets, politics and expat life.

Yesterday’s subject line: “Argentina gives Britain two weeks over Falklands oil”

Free. We send a confirmation link first — nothing arrives until you click it. Unsubscribe with one click in any edition. If you stop opening us for 30 days we stop sending by ourselves, as we assume the interest is no longer there. See our privacy policy. We never share your email.

Brazil’s economic landscape reveals a complex tapestry of regional contributions. São Paulo stands as the undisputed economic giant, generating 31% of the nation’s Gross Domestic Product (GDP). This dominance reflects the state’s industrial might and financial prowess.

The Southeast region, encompassing São Paulo, Rio de Janeiro, and Minas Gerais, accounts for 53.3% of Brazil’s GDP. This concentration of economic activity raises questions about regional disparities and development strategies.

Rio de Janeiro and Minas Gerais follow São Paulo in GDP contributions, at 11.4% and 9% respectively. These three states form the economic backbone of Brazil, shaping national policies and priorities.

Free daily brief — no card needed
Get every Brazil story in one morning email
We build you a personalized brief around the topics you follow — free for 7 days. Love it? Your first month after that is US$1.

The South region claims the second-largest share at 16.6%, with Paraná and Rio Grande do Sul leading the charge. This area’s strong agricultural and manufacturing sectors drive its economic influence.

Northeast Brazil contributes 13.8% to the national GDP, with Bahia as its top performer. The region faces challenges in closing the economic gap with its southern counterparts.
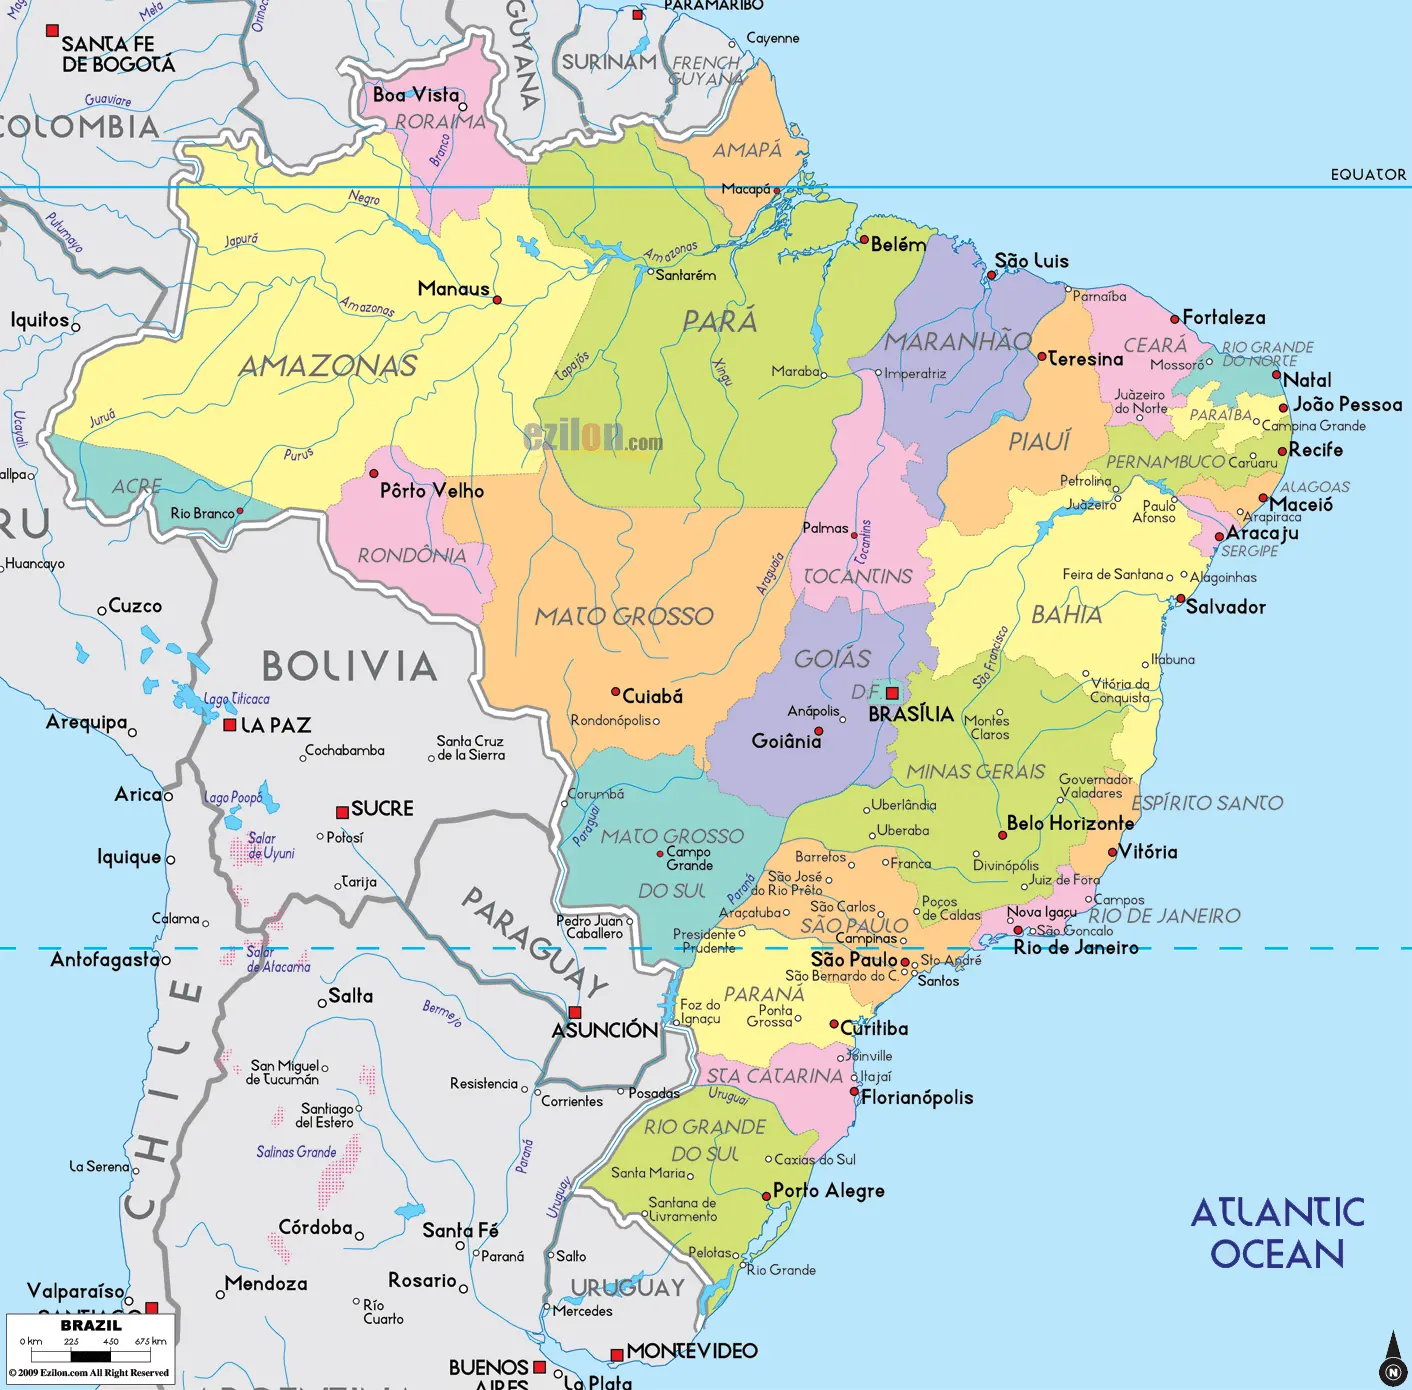
Economic Powerhouses: Unveiling Brazil's State-by-State GDP Contributions.
Economic Powerhouses: Unveiling Brazil’s State-by-State GDP Contributions.
One-stop reference
Company Intelligence
Every listed company in Latin America — financials, ownership and structure for 1,450+ companies across 26 exchanges, in one place.
Browse the directory →
RT
Ask Rio Times
This story and the bigger picture.
Open the full Ask Rio Times →

The Center-West, home to the capital Brasília, accounts for 10.6% of GDP. Its growth is fueled by agribusiness and government spending. The North region, despite its vast natural resources, contributes 5.7% to the national economy.

In 2022, Brazil’s GDP reached R$ 10.1 trillion ($1.77 trillion), growing by 3% from the previous year. This growth was not uniform across all states, highlighting regional economic disparities.

Twenty-four out of twenty-seven states experienced GDP growth in 2022. Roraima led with an impressive 11.3% increase, followed by Mato Grosso at 10.4%. These figures suggest dynamic local economies adapting to changing circumstances.

Economic Powerhouses: Unveiling Brazil’s State-by-State GDP Contributions

However, three states bucked the growth trend. Rio Grande do Sul saw a 2.6% decline, while Espírito Santo and Pará experienced contractions of 1.7% and 0.7% respectively. These declines warrant closer examination of local economic factors.

Regional performance varied significantly. The Center-West region outpaced others with 5.9% growth, driven by its robust agricultural sector. The Northeast followed with 3.6% growth, showing signs of economic progress.

The Southeast and North regions grew by 3.4% and 2% respectively. The South region remained relatively stagnant, growing by just 0.1%. This sluggish performance was largely due to Rio Grande do Sul’s agricultural setbacks.

Brazilian States’ Contributions to National GDP:

1. São Paulo – 31.1%
2. Rio de Janeiro – 11.4%
3. Minas Gerais – 9.0%
4. Paraná – 6.1%
5. Rio Grande do Sul – 5.9%
6. Santa Catarina – 4.6%
7. Bahia – 4.0%
8. Federal District – 3.3%
9. Goiás – 3.2%
10. Mato Grosso – 2.5%
11. Pernambuco – 2.4%
12. Pará – 2.3%
13. Ceará – 2.1%
14. Espírito Santo – 1.8%
15. Mato Grosso do Sul – 1.7%
16. Amazonas – 1.4%
17. Maranhão – 1.4%
18. Rio Grande do Norte – 0.9%
19. Paraíba – 0.9%
20. Alagoas – 0.8%
21. Rondônia – 0.7%
22. Piauí – 0.7%
23. Sergipe – 0.6%
24. Tocantins – 0.6%
25. Acre – 0.2%
26. Amapá – 0.2%
27. Roraima – 0.2%

This article was produced by The Rio Times’ automated newsroom system. How we use AI · Report an error

Read More from The Rio Times

The Rio Times · Power Map
See who really holds power in Latin America
Click to open the Power Map →

Rotate for Best Experience

This report is optimized for landscape viewing. Rotate your phone for the full experience.