IBOV 183,827.59 ▲ 0.46% IPSA 11,055.91 ▼ 0.73% IPC MEX 65,071.30 ▲ 0.20% MERVAL 2,782,561 ▼ 0.59% COLCAP 2,558.92 ▼ 0.79% BVL PERÚ 60,220.45 ▲ 0.32% USD/BRL5.20▼ 0.43% USD/MXN18.05▲ 0.31% USD/CLP972.08▲ 0.38% USD/COP3,323▲ 0.62% USD/PEN3.44▼ 0.05% USD/ARS1,524▼ 0.05% USD/UYU40.27▲ 3.67% USD/PYG5,843▲ 2.30% USD/BOB11.96▲ 0.45% USD/DOP59.27▲ 2.75% USD/CRC452.68▲ 2.68% USD/GTQ7.64▲ 3.13% USD/HNL26.87▲ 3.23% USD/NIO36.62▲ 2.65% USD/VES855.74▼ 0.13% USD/PAB1.00— 0.00% USD/BZD2.00— 0.00% USD/JMD 157.28 — 0.00% USD/TTD6.70▲ 1.64% EUR/BRL5.90▲ 0.05% BRENT 88.88 ▼ 0.03% WTI 83.11 ▼ 0.11% IRON ORE 161.91 — — COPPER 6.61 ▲ 0.03% GOLD 4,461 ▲ 1.78% SILVER 65.59 ▲ 1.26% SOY 1,184 ▲ 3.20% CORN 480.50 ▲ 10.02% WHEAT 655.00 ▲ 3.93% COFFEE 317.25 ▼ 5.51% SUGAR 16.43 ▼ 1.79% ORANGE JUICE 138.55 ▼ 0.47% COTTON 85.03 ▲ 2.33% COCOA 5,719 ▲ 3.18% BEEF 223.60 ▼ 3.93% CATTLE 339.10 ▼ 3.16% LITHIUM 75.20 ▲ 1.47% PETR4 41.64 ▼ 0.05% VALE3 72.97 ▲ 0.83% ITUB4 38.60 ▼ 1.03% BBDC4 16.85 ▲ 0.36% ABEV3 14.89 ▼ 0.80% BBAS3 19.37 ▲ 0.47% B3SA3 14.26 ▼ 0.21% WEGE3 47.59 ▲ 0.49% PRIO3 59.14 ▼ 0.19% SUZB3 41.33 ▲ 2.35% RENT3 34.68 ▼ 0.09% AZZA3 15.89 ▼ 2.63% CSAN3 3.22 ▼ 1.83% RAIZ4 0.25 — 0.00% PCAR3 2.75 ▼ 0.36% GMAT3 3.65 ▼ 1.08% PSSA3 48.13 ▼ 0.54% CVCB3 1.33 ▼ 2.92% POSI3 3.36 ▲ 2.44% SLCE3 13.34 ▲ 0.30% NATU3 8.14 ▼ 0.73% IBOV 183,827.59 ▲ 0.46% IPSA 11,055.91 ▼ 0.73% IPC MEX 65,071.30 ▲ 0.20% MERVAL 2,782,561 ▼ 0.59% COLCAP 2,558.92 ▼ 0.79% BVL PERÚ 60,220.45 ▲ 0.32% USD/BRL 5.16 ▲ 0.01% USD/MXN 17.06 ▼ 0.24% USD/CLP 913.98 ▲ 0.04% USD/COP 3,140 ▲ 0.03% USD/PEN 3.36 ▼ 0.66% USD/ARS 1,493 ▲ 0.10% USD/UYU 40.27 ▲ 1.24% USD/PYG 5,939 ▲ 1.68% USD/BOB 11.64 ▼ 0.76% USD/DOP 58.34 ▲ 1.25% USD/CRC 445.92 ▲ 0.89% USD/GTQ 7.62 ▲ 2.21% USD/HNL 26.79 ▲ 1.57% USD/NIO 36.62 ▲ 0.69% USD/VES 762.44 ▼ 0.13% USD/PAB 1.00 — 0.00% USD/BZD 2.00 — 0.00% USD/JMD 157.28 — 0.00% USD/TTD 6.70 ▲ 0.61% EUR/BRL 5.95 ▲ 1.01% BRENT 88.88 ▼ 0.03% WTI 83.11 ▼ 0.11% IRON ORE 161.91 — — COPPER 6.61 ▲ 0.03% GOLD 4,461 ▲ 1.78% SILVER 65.59 ▲ 1.26% SOY 1,184 ▲ 3.20% CORN 480.50 ▲ 10.02% WHEAT 655.00 ▲ 3.93% COFFEE 317.25 ▼ 5.51% SUGAR 16.43 ▼ 1.79% ORANGE JUICE 138.55 ▼ 0.47% COTTON 85.03 ▲ 2.33% COCOA 5,719 ▲ 3.18% BEEF 223.60 ▼ 3.93% CATTLE 339.10 ▼ 3.16% LITHIUM 75.20 ▲ 1.47% PETR4 41.64 ▼ 0.05% VALE3 72.97 ▲ 0.83% ITUB4 38.60 ▼ 1.03% BBDC4 16.85 ▲ 0.36% ABEV3 14.89 ▼ 0.80% BBAS3 19.37 ▲ 0.47% B3SA3 14.26 ▼ 0.21% WEGE3 47.59 ▲ 0.49% PRIO3 59.14 ▼ 0.19% SUZB3 41.33 ▲ 2.35% RENT3 34.68 ▼ 0.09% AZZA3 15.89 ▼ 2.63% CSAN3 3.22 ▼ 1.83% RAIZ4 0.25 — 0.00% PCAR3 2.75 ▼ 0.36% GMAT3 3.65 ▼ 1.08% PSSA3 48.13 ▼ 0.54% CVCB3 1.33 ▼ 2.92% POSI3 3.36 ▲ 2.44% SLCE3 13.34 ▲ 0.30% NATU3 8.14 ▼ 0.73%
since 2009
Wednesday, September 30, 2026

Brazil Business - Brazil

BRF Turns R$262M Loss into R$1.1B Profit in Q3 2024

By · November 14, 2024 · 2 min read

The LatAm Brief

One email, every weekday morning. What moved in Latin American markets, politics and expat life.

Yesterday’s subject line: “Argentina gives Britain two weeks over Falklands oil”

Free. We send a confirmation link first — nothing arrives until you click it. Unsubscribe with one click in any edition. If you stop opening us for 30 days we stop sending by ourselves, as we assume the interest is no longer there. See our privacy policy. We never share your email.

In the third quarter of 2024, BRF SA, a major Brazilian food company, achieved a stunning financial reversal. The firm posted a net profit of R$1.137 billion ($199.5 million).

This result marks a significant shift from the R$262 million loss in the same period last year. BRF’s net revenue climbed to R$15.5 billion ($2.72 billion), showing a 12.4% increase year-over-year.

The company’s adjusted EBITDA soared to R$2.968 billion ($520.7 million), reflecting a 146.4% rise. These figures underscore BRF’s successful strategy implementation and market adaptation.

Free daily brief — no card needed
Get every Brazil story in one morning email
We build you a personalized brief around the topics you follow — free for 7 days. Love it? Your first month after that is US$1.

The company’s leverage ratio reached a historic low of 0.71x, down from 2.66x a year ago. This improvement highlights BRF’s commitment to financial health and operational efficiency.

The net debt decreased to R$6.866 billion ($1.2 billion) by the end of September, further strengthening the balance sheet. In the Brazilian market, BRF‘s performance was particularly strong.
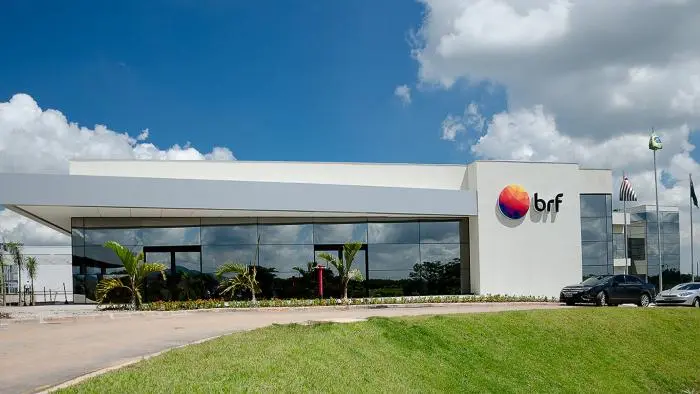
BRF Turns R$262M Loss into R$1.1B Profit in Q3 2024
BRF Turns R$262M Loss into R$1.1B Profit in Q3 2024.
RT
Ask Rio Times
Latin American markets, currencies and companies.
Open the full Ask Rio Times →

The adjusted EBITDA for domestic operations hit R$1.2 billion ($210.5 million), a 54.6% increase. Revenue in Brazil grew by 10.4% to R$7.24 billion ($1.27 billion). These results stem from improved commercial execution and strategic brand investments.

BRF’s Remarkable Growth and Strategic Moves

BRF’s international operations also showed remarkable growth. The adjusted EBITDA for this segment reached R$1.629 billion ($285.8 million), a staggering 548.5% increase.

Revenue from international markets rose by 22% to R$7.347 billion ($1.29 billion). This success reflects BRF’s effective market diversification strategy.

The company’s pricing strategy proved effective in both domestic and international markets. In Brazil, the average product price increased by 2.2% to R$11.81 per kilogram.

International markets saw a more significant price rise of 24.1% to R$13.36 per kilogram. BRF’s management attributed these positive results to several key factors.

Operational efficiency improvements, expansion of export destinations, and increased focus on processed products all contributed to the company‘s success. The firm’s market share in processed foods in Brazil reached an impressive 40%.

In a move to enhance shareholder value, BRF authorized the acquisition of an additional 30 million shares. The company also approved a distribution of R$946 million ($166 million) in interest on equity to shareholders.

These actions demonstrate BRF’s commitment to rewarding investors while maintaining financial prudence. CEO Miguel Gularte expressed confidence in the company’s direction.

He emphasized the consistent sales performance across all markets and the effectiveness of BRF’s efficiency initiatives. Gularte’s comments suggest a positive outlook for the company’s future performance.

BRF’s success story unfolds against the backdrop of a challenging global food industry. The company has navigated inflationary pressures and supply chain disruptions with skill. Its ability to adapt to changing consumer preferences has been crucial in maintaining market relevance.

Live Company IntelligenceMarfrig Global Foods SA — the full investor dossierInside: live share price, market cap, three-year financials, valuation, ESG and peer benchmarks — plus the latest Rio Times coverage.
M
◆ Live Company Intelligence
Marfrig Global Foods
SA: MBRF3MBRF3Consumer DefensivePackaged Foods130,000 employees
R$23.97B
Market cap

Valuation & profitability

Market capR$23.97B
Revenue (TTM)R$165.85B
P / E ratio59.3
Profit margin0.2%
Return on equity0.9%

Price & risk

52-wk low
$14.49
52-wk high
$26.83
Beta (volatility)0.02
200-day average$17.89

Revenue trend · 6y

20202025
Latest R$163.96B

Ownership

Institutions34.9%
Shares outstanding1.39B

Dividend

No regular dividend — earnings reinvested for growth.
What Marfrig Global Foods does. MBRF Global Foods Company S.A., through its subsidiaries, operates in the food industry in Brazil and internationally. It operates through Beef North America, Beef South America, and BRF segments. The company produces, processes, distributes, and sells animal-based proteins, such as beef, pork, lamb, fish, and poultry; pasta, margarine, vegetable, pet food, and…
Data: RT fundamentals (MBRF3.SA) · figures in BRL · as of 29 Sep 2026More company intelligence →

This article was produced by The Rio Times’ automated newsroom system. How we use AI · Report an error

LatAm Markets: Live Signals → — real-time movers, turnover leaders and FX across Latin America.

Read More from The Rio Times

The Rio Times · Power Map
See who really holds power in Latin America
Click to open the Power Map →

Rotate for Best Experience

This report is optimized for landscape viewing. Rotate your phone for the full experience.