IBOV 176,444.54 ▼ 0.62% IPSA 10,924.91 ▼ 0.77% IPC MEX 67,298.78 ▲ 0.88% MERVAL 3,340,763 ▼ 1.15% COLCAP 2,298.59 ▲ 0.07% BVL PERÚ 57,575.02 — — USD/BRL5.08▲ 0.59% USD/MXN17.52▲ 0.77% USD/CLP946.49▲ 1.16% USD/COP3,197▼ 0.93% USD/PEN3.39▼ 0.24% USD/ARS1,489▲ 0.40% USD/UYU40.14▲ 1.16% USD/PYG6,025▲ 1.20% USD/BOB11.03▲ 3.57% USD/DOP57.95▼ 0.09% USD/CRC451.03▲ 2.18% USD/GTQ7.62▲ 2.29% USD/HNL26.74▲ 0.88% USD/NIO36.62▲ 0.31% USD/VES736.04▼ 0.13% USD/PAB1.00— 0.00% USD/BZD2.00— 0.00% USD/JMD157.69▲ 0.48% USD/TTD6.73▲ 1.11% EUR/BRL5.79▼ 0.20% BRENT 100.09 ▲ 6.40% WTI 91.72 ▲ 5.63% IRON ORE 161.91 — — COPPER 6.32 ▼ 2.09% GOLD 4,048 ▼ 2.40% SILVER 57.76 ▼ 3.77% SOY 1,241 ▲ 0.65% CORN 486.75 ▲ 5.36% WHEAT 694.50 ▼ 1.59% COFFEE 310.75 ▼ 1.86% SUGAR 14.68 ▼ 0.41% ORANGE JUICE 145.50 ▼ 3.19% COTTON 81.53 ▲ 2.08% COCOA 5,367 ▲ 0.73% BEEF 221.48 ▼ 0.77% CATTLE 340.13 ▼ 0.31% LITHIUM 68.89 ▼ 0.16% PETR4 42.89 ▲ 0.73% VALE3 75.44 ▲ 0.45% ITUB4 42.47 ▼ 1.00% BBDC4 18.76 ▼ 1.11% ABEV3 15.88 ▼ 1.55% BBAS3 20.94 ▼ 0.71% B3SA3 15.64 ▼ 1.64% WEGE3 45.10 ▼ 3.51% PRIO3 60.96 ▲ 1.99% SUZB3 42.37 ▼ 0.68% RENT3 36.96 ▼ 0.48% AZZA3 17.10 ▼ 3.99% CSAN3 3.91 ▼ 0.26% RAIZ4 0.27 — 0.00% PCAR3 2.87 ▲ 4.36% GMAT3 3.86 ▼ 1.28% PSSA3 55.26 ▼ 0.34% CVCB3 1.32 ▲ 3.94% POSI3 3.61 ▼ 2.43% SLCE3 13.74 ▼ 1.58% NATU3 8.61 ▼ 0.81% BRKM5 6.21 ▲ 2.31% RANI3 7.95 ▼ 0.63% CSNA3 5.33 ▼ 0.93% CMIN3 5.89 ▲ 0.86% USIM5 8.49 ▼ 1.85% GGBR4 24.06 — 0.00% ENEV3 25.72 ▼ 0.96% CPFE3 46.37 ▼ 0.73% CMIG4 11.21 — 0.00% EQTL3 38.99 ▼ 0.91% LREN3 13.40 ▼ 1.03% VIVT3 34.65 ▼ 2.06% RAIL3 13.95 ▲ 2.27% KLABIN 17.63 ▼ 1.67% RAIA DROGASIL 18.21 ▼ 0.44% RDOR3 33.83 ▼ 1.91% HAPV3 10.57 ▼ 7.20% FLRY3 16.64 ▼ 0.06% SMTO3 15.79 ▼ 1.62% UGPA3 33.17 ▲ 1.04% VBBR3 35.57 ▲ 1.69% BBSE3 42.54 ▼ 0.09% BPAC11 56.13 ▼ 1.56% CURY3 29.58 ▼ 2.05% AERI3 2.02 ▼ 1.46% VIVARA 21.57 ▲ 0.09% COMPASS 25.10 ▲ 1.17% VAMOS 3.19 ▼ 1.24% SANB11 26.61 ▼ 1.26% ASAI3 8.04 ▼ 4.29% SBSP3 29.00 ▼ 0.99% WALMEX 47.11 ▼ 3.17% GMEXICO 208.22 ▼ 3.16% FEMSA 222.68 ▼ 2.22% CEMEX 21.47 ▼ 3.16% GFNORTE 189.93 ▼ 0.88% BIMBO 59.16 ▼ 1.89% TELEVISA 9.83 ▲ 0.10% AMX 22.80 ▲ 0.48% GAP 377.43 ▲ 0.19% ASUR 269.72 ▼ 1.39% OMA 227.25 ▼ 0.63% KOF 179.87 ▼ 1.52% GRUMA 270.49 ▼ 3.55% KIMBER 39.20 ▲ 0.98% SQM-B 65,701 ▲ 0.99% COPEC 6,452 ▼ 1.50% BSANTANDER 79.56 ▼ 0.36% FALABELLA 6,080 ▲ 0.63% ENELAM 84.53 — 0.00% CENCOSUD 1,971 ▼ 1.93% CMPC 1,047 ▼ 2.15% BANCO CHILE 191.16 ▼ 1.21% LATAM AIR 23.62 ▼ 1.95% YPF 82,725 ▲ 0.27% GGAL 7,995 ▼ 3.38% PAMPA 5,640 ▲ 0.27% TXAR 681.50 ▲ 2.02% ALUAR 985.00 ▲ 1.13% TGS 10,060 ▲ 1.56% CEPU 2,423 ▲ 0.50% MIRGOR 16,800 ▼ 0.74% COME 42.88 ▼ 0.60% LOMA NEGRA 3,768 ▼ 1.12% BYMA 293.00 ▼ 0.85% TELECOM ARG 4,313 ▼ 2.43% ECOPETROL 16.42 ▼ 1.62% BANCOLOMBIA 86.37 ▲ 2.02% GRUPO AVAL 4.93 ▼ 2.18% CREDICORP 388.87 ▼ 1.22% SOUTHERN COPPER 183.84 ▼ 5.95% BUENAVENTURA 31.24 ▼ 2.65% MERCADOLIBRE 1,791 ▼ 0.47% NUBANK 14.24 ▼ 1.87% XP 16.83 ▼ 2.75% PAGSEGURO 9.44 ▼ 2.43% STONE 10.94 ▼ 3.70% GLOBANT 30.37 ▼ 0.98% TECNOGLASS 43.78 ▼ 3.19% GAP AIRPORT 215.36 ▼ 1.00% ASUR 269.72 ▼ 1.39% OMA AIRPORT 103.89 ▼ 1.39% AMX ADR 25.93 ▼ 0.75% FEMSA ADR 127.22 ▼ 2.83% CEMEX ADR 12.25 ▼ 3.73% PETROBRAS ADR 19.00 ▲ 0.56% VALE ADR 14.81 ▼ 0.30% ITAU ADR 8.35 ▼ 1.59% SANTANDER BR 5.35 ▼ 1.93% AMBEV ADR 3.10 ▼ 1.43% CSN 1.06 ▼ 2.75% GERDAU 4.73 ▼ 0.84% LATAM ADR 49.67 ▼ 3.10% BTC 64,656 ▼ 2.19% ETH 1,870 ▼ 3.31% SOL 75.46 ▼ 3.14% XRP 1.10 ▼ 3.36% BNB 565.39 ▼ 0.94% ADA 0.17 ▼ 3.10% DOGE 0.07 ▼ 5.43% AVAX 6.26 ▼ 5.40% LINK 8.44 ▼ 2.16% DOT 0.81 ▼ 2.54% LTC 46.87 ▼ 0.43% BCH 209.71 ▼ 4.66% TRX 0.33 ▼ 0.57% XLM 0.18 ▼ 2.68% HBAR 0.07 ▼ 1.07% NEAR 1.87 ▲ 0.06% ATOM 1.42 ▼ 3.17% AAVE 95.19 ▼ 2.23% SELIC 14.25% EMBRAER 83.77 ▼ 0.02% EMBRAER ADR 65.99 ▼ 0.09% JBS 12.11 ▼ 1.18% JBS BDR 61.51 ▼ 0.47% MBRF3 15.72 ▼ 1.93% MBRFY 3.06 ▼ 4.08% INTER 5.41 ▼ 4.92% EGX 53,932 ▼ 0.11% USD/ZAR16.82▲ 2.59% USD/NGN1,366▼ 0.48% NIKKEI 66,423 ▲ 0.46% CSI300 4,728 ▲ 0.23% HSI 25,211 ▲ 1.28% NIFTY 23,870 ▼ 0.53% KOSPI 7,097 ▲ 4.40% JCI 6,315 ▼ 0.30% USD/JPY163.83▲ 0.42% USD/CNY6.77▼ 0.05% DAX 24,763 ▼ 1.56% CAC 8,299 ▼ 1.64% FTSE 10,639 ▼ 0.73% MIB 51,316 ▼ 2.80% IBEX 19,267 ▼ 1.55% STOXX 639.27 ▼ 1.18% EUR/USD1.14▼ 0.28% GBP/USD1.33▼ 0.46% SPX 7,399 ▼ 1.34% DJI 51,687 ▼ 1.02% NDX 28,425 ▼ 1.98% RUT 2,933 ▼ 0.91% TSX 35,155 ▼ 0.93% VIX 19.51 ▲ 17.25% USD/CAD1.41▼ 0.05% US10Y 4.7030 ▲ 0.99% IBOV 176,444.54 ▼ 0.62% IPSA 10,924.91 ▼ 0.77% IPC MEX 67,298.78 ▲ 0.88% MERVAL 3,340,763 ▼ 1.15% COLCAP 2,298.59 ▲ 0.07% BVL PERÚ 57,575.02 — — USD/BRL 5.08 ▲ 0.59% USD/MXN 17.52 ▲ 0.77% USD/CLP 946.49 ▲ 1.16% USD/COP 3,197 ▼ 0.93% USD/PEN 3.39 ▼ 0.24% USD/ARS 1,489 ▲ 0.40% USD/UYU 40.14 ▲ 1.16% USD/PYG 6,025 ▲ 1.20% USD/BOB 11.03 ▲ 3.57% USD/DOP 57.95 ▼ 0.09% USD/CRC 451.03 ▲ 2.18% USD/GTQ 7.62 ▲ 2.29% USD/HNL 26.74 ▲ 0.88% USD/NIO 36.62 ▲ 0.31% USD/VES 736.04 ▼ 0.13% USD/PAB 1.00 — 0.00% USD/BZD 2.00 — 0.00% USD/JMD 157.69 ▲ 0.48% USD/TTD 6.73 ▲ 1.11% EUR/BRL 5.79 ▼ 0.20% BRENT 100.09 ▲ 6.40% WTI 91.72 ▲ 5.63% IRON ORE 161.91 — — COPPER 6.32 ▼ 2.09% GOLD 4,048 ▼ 2.40% SILVER 57.76 ▼ 3.77% SOY 1,241 ▲ 0.65% CORN 486.75 ▲ 5.36% WHEAT 694.50 ▼ 1.59% COFFEE 310.75 ▼ 1.86% SUGAR 14.68 ▼ 0.41% ORANGE JUICE 145.50 ▼ 3.19% COTTON 81.53 ▲ 2.08% COCOA 5,367 ▲ 0.73% BEEF 221.48 ▼ 0.77% CATTLE 340.13 ▼ 0.31% LITHIUM 68.89 ▼ 0.16% PETR4 42.89 ▲ 0.73% VALE3 75.44 ▲ 0.45% ITUB4 42.47 ▼ 1.00% BBDC4 18.76 ▼ 1.11% ABEV3 15.88 ▼ 1.55% BBAS3 20.94 ▼ 0.71% B3SA3 15.64 ▼ 1.64% WEGE3 45.10 ▼ 3.51% PRIO3 60.96 ▲ 1.99% SUZB3 42.37 ▼ 0.68% RENT3 36.96 ▼ 0.48% AZZA3 17.10 ▼ 3.99% CSAN3 3.91 ▼ 0.26% RAIZ4 0.27 — 0.00% PCAR3 2.87 ▲ 4.36% GMAT3 3.86 ▼ 1.28% PSSA3 55.26 ▼ 0.34% CVCB3 1.32 ▲ 3.94% POSI3 3.61 ▼ 2.43% SLCE3 13.74 ▼ 1.58% NATU3 8.61 ▼ 0.81% BRKM5 6.21 ▲ 2.31% RANI3 7.95 ▼ 0.63% CSNA3 5.33 ▼ 0.93% CMIN3 5.89 ▲ 0.86% USIM5 8.49 ▼ 1.85% GGBR4 24.06 — 0.00% ENEV3 25.72 ▼ 0.96% CPFE3 46.37 ▼ 0.73% CMIG4 11.21 — 0.00% EQTL3 38.99 ▼ 0.91% LREN3 13.40 ▼ 1.03% VIVT3 34.65 ▼ 2.06% RAIL3 13.95 ▲ 2.27% KLABIN 17.63 ▼ 1.67% RAIA DROGASIL 18.21 ▼ 0.44% RDOR3 33.83 ▼ 1.91% HAPV3 10.57 ▼ 7.20% FLRY3 16.64 ▼ 0.06% SMTO3 15.79 ▼ 1.62% UGPA3 33.17 ▲ 1.04% VBBR3 35.57 ▲ 1.69% BBSE3 42.54 ▼ 0.09% BPAC11 56.13 ▼ 1.56% CURY3 29.58 ▼ 2.05% AERI3 2.02 ▼ 1.46% VIVARA 21.57 ▲ 0.09% COMPASS 25.10 ▲ 1.17% VAMOS 3.19 ▼ 1.24% SANB11 26.61 ▼ 1.26% ASAI3 8.04 ▼ 4.29% SBSP3 29.00 ▼ 0.99% WALMEX 47.11 ▼ 3.17% GMEXICO 208.22 ▼ 3.16% FEMSA 222.68 ▼ 2.22% CEMEX 21.47 ▼ 3.16% GFNORTE 189.93 ▼ 0.88% BIMBO 59.16 ▼ 1.89% TELEVISA 9.83 ▲ 0.10% AMX 22.80 ▲ 0.48% GAP 377.43 ▲ 0.19% ASUR 269.72 ▼ 1.39% OMA 227.25 ▼ 0.63% KOF 179.87 ▼ 1.52% GRUMA 270.49 ▼ 3.55% KIMBER 39.20 ▲ 0.98% SQM-B 65,701 ▲ 0.99% COPEC 6,452 ▼ 1.50% BSANTANDER 79.56 ▼ 0.36% FALABELLA 6,080 ▲ 0.63% ENELAM 84.53 — 0.00% CENCOSUD 1,971 ▼ 1.93% CMPC 1,047 ▼ 2.15% BANCO CHILE 191.16 ▼ 1.21% LATAM AIR 23.62 ▼ 1.95% YPF 82,725 ▲ 0.27% GGAL 7,995 ▼ 3.38% PAMPA 5,640 ▲ 0.27% TXAR 681.50 ▲ 2.02% ALUAR 985.00 ▲ 1.13% TGS 10,060 ▲ 1.56% CEPU 2,423 ▲ 0.50% MIRGOR 16,800 ▼ 0.74% COME 42.88 ▼ 0.60% LOMA NEGRA 3,768 ▼ 1.12% BYMA 293.00 ▼ 0.85% TELECOM ARG 4,313 ▼ 2.43% ECOPETROL 16.42 ▼ 1.62% BANCOLOMBIA 86.37 ▲ 2.02% GRUPO AVAL 4.93 ▼ 2.18% CREDICORP 388.87 ▼ 1.22% SOUTHERN COPPER 183.84 ▼ 5.95% BUENAVENTURA 31.24 ▼ 2.65% MERCADOLIBRE 1,791 ▼ 0.47% NUBANK 14.24 ▼ 1.87% XP 16.83 ▼ 2.75% PAGSEGURO 9.44 ▼ 2.43% STONE 10.94 ▼ 3.70% GLOBANT 30.37 ▼ 0.98% TECNOGLASS 43.78 ▼ 3.19% GAP AIRPORT 215.36 ▼ 1.00% ASUR 269.72 ▼ 1.39% OMA AIRPORT 103.89 ▼ 1.39% AMX ADR 25.93 ▼ 0.75% FEMSA ADR 127.22 ▼ 2.83% CEMEX ADR 12.25 ▼ 3.73% PETROBRAS ADR 19.00 ▲ 0.56% VALE ADR 14.81 ▼ 0.30% ITAU ADR 8.35 ▼ 1.59% SANTANDER BR 5.35 ▼ 1.93% AMBEV ADR 3.10 ▼ 1.43% CSN 1.06 ▼ 2.75% GERDAU 4.73 ▼ 0.84% LATAM ADR 49.67 ▼ 3.10% BTC 64,656 ▼ 2.19% ETH 1,870 ▼ 3.31% SOL 75.46 ▼ 3.14% XRP 1.10 ▼ 3.36% BNB 565.39 ▼ 0.94% ADA 0.17 ▼ 3.10% DOGE 0.07 ▼ 5.43% AVAX 6.26 ▼ 5.40% LINK 8.44 ▼ 2.16% DOT 0.81 ▼ 2.54% LTC 46.87 ▼ 0.43% BCH 209.71 ▼ 4.66% TRX 0.33 ▼ 0.57% XLM 0.18 ▼ 2.68% HBAR 0.07 ▼ 1.07% NEAR 1.87 ▲ 0.06% ATOM 1.42 ▼ 3.17% AAVE 95.19 ▼ 2.23% SELIC 14.25% EMBRAER 83.77 ▼ 0.02% EMBRAER ADR 65.99 ▼ 0.09% JBS 12.11 ▼ 1.18% JBS BDR 61.51 ▼ 0.47% MBRF3 15.72 ▼ 1.93% MBRFY 3.06 ▼ 4.08% INTER 5.41 ▼ 4.92% EGX 53,932 ▼ 0.11% USD/ZAR 16.83 ▲ 2.56% USD/NGN 1,366 ▼ 0.27% NIKKEI 66,423 ▲ 0.46% CSI300 4,728 ▲ 0.23% HSI 25,211 ▲ 1.28% NIFTY 23,870 ▼ 0.53% KOSPI 7,097 ▲ 4.40% JCI 6,315 ▼ 0.30% USD/JPY 163.80 ▲ 0.44% USD/CNY 6.7696 ▲ 0.08% DAX 24,763 ▼ 1.56% CAC 8,299 ▼ 1.64% FTSE 10,639 ▼ 0.73% MIB 51,316 ▼ 2.80% IBEX 19,267 ▼ 1.55% STOXX 639.27 ▼ 1.18% EUR/USD 1.1379 ▼ 0.26% GBP/USD 1.3316 ▼ 0.45% SPX 7,399 ▼ 1.34% DJI 51,687 ▼ 1.02% NDX 28,425 ▼ 1.98% RUT 2,933 ▼ 0.91% TSX 35,155 ▼ 0.93% VIX 19.51 ▲ 17.25% USD/CAD 1.4079 ▼ 0.02% US10Y 4.7030 ▲ 0.99%
since 2009
Thursday, July 23, 2026

Brazil Business - Brazil

BRF Achieves Strong Turnaround with Q2 2024 Profit

By · August 15, 2024 · 4 min read

Daily Brief

The morning intel from across Latin America. Free.

By subscribing you agree to our privacy policy. We never share your email.

The financial performance of BRF (BRFS3) in the second quarter of 2024 (2Q24) marks a significant turnaround. The company showcases robust growth and improved financial health.

BRF S.A. is a major Brazilian multinational food company and one of the largest global meat producers.

The company specializes in the production and distribution of fresh and frozen protein foods, including poultry, pork, and processed foods.

BRF operates internationally, with a significant presence in the Middle East, Asia, and Europe, in addition to its strong domestic market in Brazil.

Financial Performance Overview

Net Income:

BRF reported a net profit of R$ 1.094 billion ($198.91 million) in 2Q24. This reversed a loss of R$1.337 billion ($243.09 million) in 2Q23. The turnaround highlights successful strategic initiatives and operational improvements.
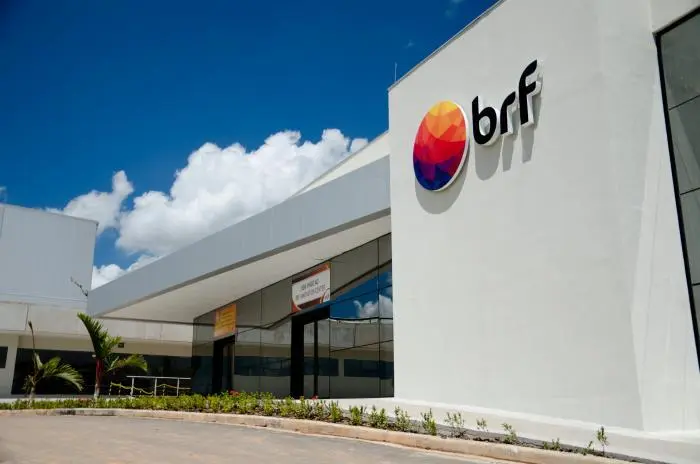
BRF Achieves Strong Turnaround with Q2 2024 Profit
BRF Achieves Strong Turnaround with Q2 2024 Profit. (Photo Internet reproduction)
RT
Ask Rio Times
Latin American markets, currencies and companies.
Open the full Ask Rio Times →

Adjusted EBITDA:

The company’s adjusted EBITDA soared by 160.4%, rising from R$ 1.006 billion ($182.91 million) in 2Q23 to R$ 2.621 billion ($476.55 million) in 2Q24. This substantial increase indicates enhanced operational efficiency and cost management.

Revenue Growth:

BRF achieved a 22.3% increase in net revenue, reaching R$ 14.93 billion ($2.71 billion) in 2Q24. This growth reflects strong market demand and effective sales strategies.

Financial Health

Leverage Reduction:

The company’s leverage, measured by the net debt-to-EBITDA ratio, improved significantly. It decreased from 3.75 times in 2Q23 to 1.14 times by June 2024.

This reduction underscores BRF’s focus on strengthening its balance sheet and reducing financial risk.

Free Cash Flow:

BRF generated R$ 1.7 billion ($309.09 million) in free cash flow during the quarter. This more than doubled the R$844 million ($153.45 million) recorded in the first quarter of 2024. The increase in cash flow is crucial for funding future growth and reducing debt.

Strategic Initiatives

Commercial Execution and Innovation:

Management attributed the positive results to continuous improvements in commercial execution. They focused on profitability and brand investments.

These efforts drove significant volume growth across all categories in Brazil, particularly in processed foods.

International Operations:

In the international segment, BRF achieved an EBITDA of R$1.5 billion ($272.73 million). The impressive margin stood at 21%.

However, this performance highlights the company’s successful global expansion and market penetration.

Export Diversification:

BRF secured 32 new export authorizations. These contributed to increased export volumes and revenue potential. This diversification strategy mitigates domestic market risks and captures international opportunities.

To provide a comprehensive analysis of BRF’s Q2 2024 results, it is essential to include a competitive analysis.

Market benchmarking against the main competitors in the food processing industry is also necessary. This analysis incorporates a broader market perspective to understand BRF’s positioning and strategy.

Competitive Analysis

BRF operates in a highly competitive market. Key competitors include JBS S.A., Marfrig Global Foods, and Tyson Foods. Here is a comparison of BRF’s performance relative to these competitors:

Profitability:

BRF reported a net profit of R$ 1.094 billion ($198.91 million) in Q2 2024. This marks a significant turnaround from a loss in the previous year.

BRF positions itself favorably against competitors like JBS and Marfrig. They also focus on improving profitability through cost management and operational efficiencies.

EBITDA Growth:

BRF’s adjusted EBITDA grew by 160.4% to R$ 2.621 billion ($476.55 million). This growth rate is notably higher than the industry average. It indicates superior operational performance.

In comparison, JBS and Marfrig also reported EBITDA improvements, but at a slower pace. BRF’s effective cost control and revenue enhancement strategies reflect this.

Leverage and Financial Health:

BRF reduced its leverage ratio to 1.14 times. This marks a significant improvement from 3.75 times in the previous year. This reduction is crucial for financial stability.

In addition, it is better than some competitors, who still manage higher debt levels. This positions BRF as a financially healthier option in the market.

Market Analysis

The food processing industry is characterized by intense competition. Price sensitivity and a need for constant innovation are also present. Here are some key market dynamics affecting BRF and its competitors:

Global Demand:

The global demand for processed and packaged foods continues to grow. Population growth and urbanization drive this demand. BRF focuses on expanding export capabilities.

This is evidenced by 32 new export authorizations. The company positions itself well to capture international market share, especially in regions with high demand growth.

Consumer Preferences:

There is a shift towards healthier and more sustainable food options. BRF’s strategy focuses on innovation and brand investment.

Additionally, this aligns with consumer trends. It potentially gives BRF an edge over competitors who may be slower to adapt.

Regulatory Environment:

The industry is heavily regulated. There are stringent requirements for food safety and quality.

In addition, BRF’s ability to secure new export authorizations indicates compliance with international standards. This provides a competitive advantage in global markets.

Benchmarking

Benchmarking against industry leaders involves evaluating BRF’s practices against the best in the sector.

Operational Efficiency:

BRF’s significant EBITDA growth and leverage reduction suggest the implementation of best practices in operational efficiency.

However, this is similar to industry leaders like Tyson Foods, known for their efficient supply chain management.

Innovation and Brand Strategy:

BRF’s focus on innovation and brand strength is akin to strategies employed by leading global food companies. This approach is essential for maintaining market relevance and driving long-term growth.

Market Diversification:

BRF’s expansion into new export markets is a strategic move. It mirrors successful diversification strategies used by global competitors. This allows BRF to mitigate the risks associated with domestic market fluctuations.

In conclusion, BRF’s Q2 2024 results demonstrate a strong competitive position. The company aligns strategically with market trends.

Its financial health, operational efficiency, and focus on innovation provide a solid foundation. BRF is poised for continued growth and competitiveness in the global food processing industry.

Live Company IntelligenceMarfrig Global Foods SA — the full investor dossierInside: live share price, market cap, three-year financials, valuation, ESG and peer benchmarks — plus the latest Rio Times coverage.
M
◆ Live Company Intelligence
Marfrig Global Foods
SA: MBRF3MBRF3Consumer DefensivePackaged Foods130,000 employees
R$22.16B
Market cap

Valuation & profitability

Market capR$22.16B
Revenue (TTM)R$163.94B
P / E ratio48.6
Profit margin0.2%
Return on equity1.8%

Price & risk

52-wk low
$14.49
52-wk high
$26.83
Beta (volatility)0.01
200-day average$18.32

Revenue trend · 6y

20202025
Latest R$163.96B

Ownership

Institutions32.8%
Shares outstanding1.38B

Dividend

Yield18.6%
Payout ratio6.6%
Fwd. annual$5.64
What Marfrig Global Foods does. MBRF Global Foods Company S.A., through its subsidiaries, operates in the food industry in Brazil and internationally. It operates through Beef North America, Beef South America, and BRF segments. The company produces, processes, distributes, and sells animal-based proteins, such as beef, pork, lamb, fish, and poultry; pasta, margarine, vegetable, pet food, and…
Data: EODHD fundamentals (MBRF3.SA) · figures in BRL · as of 23 Jul 2026More company intelligence →

LatAm Markets: Live Signals → — real-time movers, turnover leaders and FX across Latin America.

Read More from The Rio Times

The Rio Times · Power Map
See who really holds power in Latin America
Click to open the Power Map

Rotate for Best Experience

This report is optimized for landscape viewing. Rotate your phone for the full experience.