IBOV 183,827.59 ▲ 0.46% IPSA 11,055.91 ▼ 0.73% IPC MEX 65,071.30 ▲ 0.20% MERVAL 2,782,561 ▼ 0.59% COLCAP 2,558.92 ▼ 0.79% BVL PERÚ 60,220.45 ▲ 0.32% USD/BRL5.20▼ 0.43% USD/MXN18.08▲ 0.46% USD/CLP972.08▲ 0.38% USD/COP3,323▲ 0.62% USD/PEN3.44— 0.00% USD/ARS1,524▼ 0.05% USD/UYU40.27▲ 3.67% USD/PYG5,843▲ 2.30% USD/BOB11.96▲ 0.45% USD/DOP59.27▲ 2.75% USD/CRC452.68▲ 2.68% USD/GTQ7.64▲ 3.13% USD/HNL26.87▲ 3.23% USD/NIO36.62▲ 2.65% USD/VES856.92▲ 0.01% USD/PAB1.00— 0.00% USD/BZD2.00— 0.00% USD/JMD 157.28 — 0.00% USD/TTD6.70▲ 1.64% EUR/BRL5.90▲ 0.03% BRENT 88.88 ▼ 0.03% WTI 83.11 ▼ 0.11% IRON ORE 161.91 — — COPPER 6.61 ▲ 0.03% GOLD 4,461 ▲ 1.78% SILVER 65.59 ▲ 1.26% SOY 1,184 ▲ 3.20% CORN 480.50 ▲ 10.02% WHEAT 655.00 ▲ 3.93% COFFEE 317.25 ▼ 5.51% SUGAR 16.43 ▼ 1.79% ORANGE JUICE 138.55 ▼ 0.47% COTTON 85.03 ▲ 2.33% COCOA 5,719 ▲ 3.18% BEEF 223.60 ▼ 3.93% CATTLE 339.10 ▼ 3.16% LITHIUM 75.20 ▲ 1.47% PETR4 41.64 ▼ 0.05% VALE3 72.97 ▲ 0.83% ITUB4 38.60 ▼ 1.03% BBDC4 16.85 ▲ 0.36% ABEV3 14.89 ▼ 0.80% BBAS3 19.37 ▲ 0.47% B3SA3 14.26 ▼ 0.21% WEGE3 47.59 ▲ 0.49% PRIO3 59.14 ▼ 0.19% SUZB3 41.33 ▲ 2.35% RENT3 34.68 ▼ 0.09% AZZA3 15.89 ▼ 2.63% CSAN3 3.22 ▼ 1.83% RAIZ4 0.25 — 0.00% PCAR3 2.75 ▼ 0.36% GMAT3 3.65 ▼ 1.08% PSSA3 48.13 ▼ 0.54% CVCB3 1.33 ▼ 2.92% POSI3 3.36 ▲ 2.44% SLCE3 13.34 ▲ 0.30% NATU3 8.14 ▼ 0.73% IBOV 183,827.59 ▲ 0.46% IPSA 11,055.91 ▼ 0.73% IPC MEX 65,071.30 ▲ 0.20% MERVAL 2,782,561 ▼ 0.59% COLCAP 2,558.92 ▼ 0.79% BVL PERÚ 60,220.45 ▲ 0.32% USD/BRL 5.16 ▲ 0.01% USD/MXN 17.06 ▼ 0.24% USD/CLP 913.98 ▲ 0.04% USD/COP 3,140 ▲ 0.03% USD/PEN 3.36 ▼ 0.66% USD/ARS 1,493 ▲ 0.10% USD/UYU 40.27 ▲ 1.24% USD/PYG 5,939 ▲ 1.68% USD/BOB 11.64 ▼ 0.76% USD/DOP 58.34 ▲ 1.25% USD/CRC 445.92 ▲ 0.89% USD/GTQ 7.62 ▲ 2.21% USD/HNL 26.79 ▲ 1.57% USD/NIO 36.62 ▲ 0.69% USD/VES 762.44 ▼ 0.13% USD/PAB 1.00 — 0.00% USD/BZD 2.00 — 0.00% USD/JMD 157.28 — 0.00% USD/TTD 6.70 ▲ 0.61% EUR/BRL 5.95 ▲ 1.01% BRENT 88.88 ▼ 0.03% WTI 83.11 ▼ 0.11% IRON ORE 161.91 — — COPPER 6.61 ▲ 0.03% GOLD 4,461 ▲ 1.78% SILVER 65.59 ▲ 1.26% SOY 1,184 ▲ 3.20% CORN 480.50 ▲ 10.02% WHEAT 655.00 ▲ 3.93% COFFEE 317.25 ▼ 5.51% SUGAR 16.43 ▼ 1.79% ORANGE JUICE 138.55 ▼ 0.47% COTTON 85.03 ▲ 2.33% COCOA 5,719 ▲ 3.18% BEEF 223.60 ▼ 3.93% CATTLE 339.10 ▼ 3.16% LITHIUM 75.20 ▲ 1.47% PETR4 41.64 ▼ 0.05% VALE3 72.97 ▲ 0.83% ITUB4 38.60 ▼ 1.03% BBDC4 16.85 ▲ 0.36% ABEV3 14.89 ▼ 0.80% BBAS3 19.37 ▲ 0.47% B3SA3 14.26 ▼ 0.21% WEGE3 47.59 ▲ 0.49% PRIO3 59.14 ▼ 0.19% SUZB3 41.33 ▲ 2.35% RENT3 34.68 ▼ 0.09% AZZA3 15.89 ▼ 2.63% CSAN3 3.22 ▼ 1.83% RAIZ4 0.25 — 0.00% PCAR3 2.75 ▼ 0.36% GMAT3 3.65 ▼ 1.08% PSSA3 48.13 ▼ 0.54% CVCB3 1.33 ▼ 2.92% POSI3 3.36 ▲ 2.44% SLCE3 13.34 ▲ 0.30% NATU3 8.14 ▼ 0.73%
since 2009
Wednesday, September 30, 2026

Agri Business Business - Brazil

Brazil’s Agricultural Output Drops 2.3% Despite Record Grain Harvest

By · September 12, 2024 · 2 min read

The LatAm Brief

One email, every weekday morning. What moved in Latin American markets, politics and expat life.

Yesterday’s subject line: “Argentina gives Britain two weeks over Falklands oil”

Free. We send a confirmation link first — nothing arrives until you click it. Unsubscribe with one click in any edition. If you stop opening us for 30 days we stop sending by ourselves, as we assume the interest is no longer there. See our privacy policy. We never share your email.

Brazil’s agricultural sector saw crop production value fall 2.3% to R$814.5 billion ($144.16 billion) in 2023, ending a six-year growth streak.

Despite this decline, the grain harvest reached a record-breaking 316.4 million tons, a 19.6% increase from the previous year. This paradox highlights the intricate nature of agricultural economics.

The total planted area expanded by 5.5%, covering 96.3 million hectares. This growth aligns with the trend observed in recent years, according to IBGE data.

Free daily brief — no card needed
Get every Agri Business story in one morning email
We build you a personalized brief around the topics you follow — free for 7 days. Love it? Your first month after that is US$1.

Soybean, sugarcane, corn, cotton, and coffee topped the production value rankings. Soybean production increased by 0.4%, while sugarcane saw an 8.5% rise.
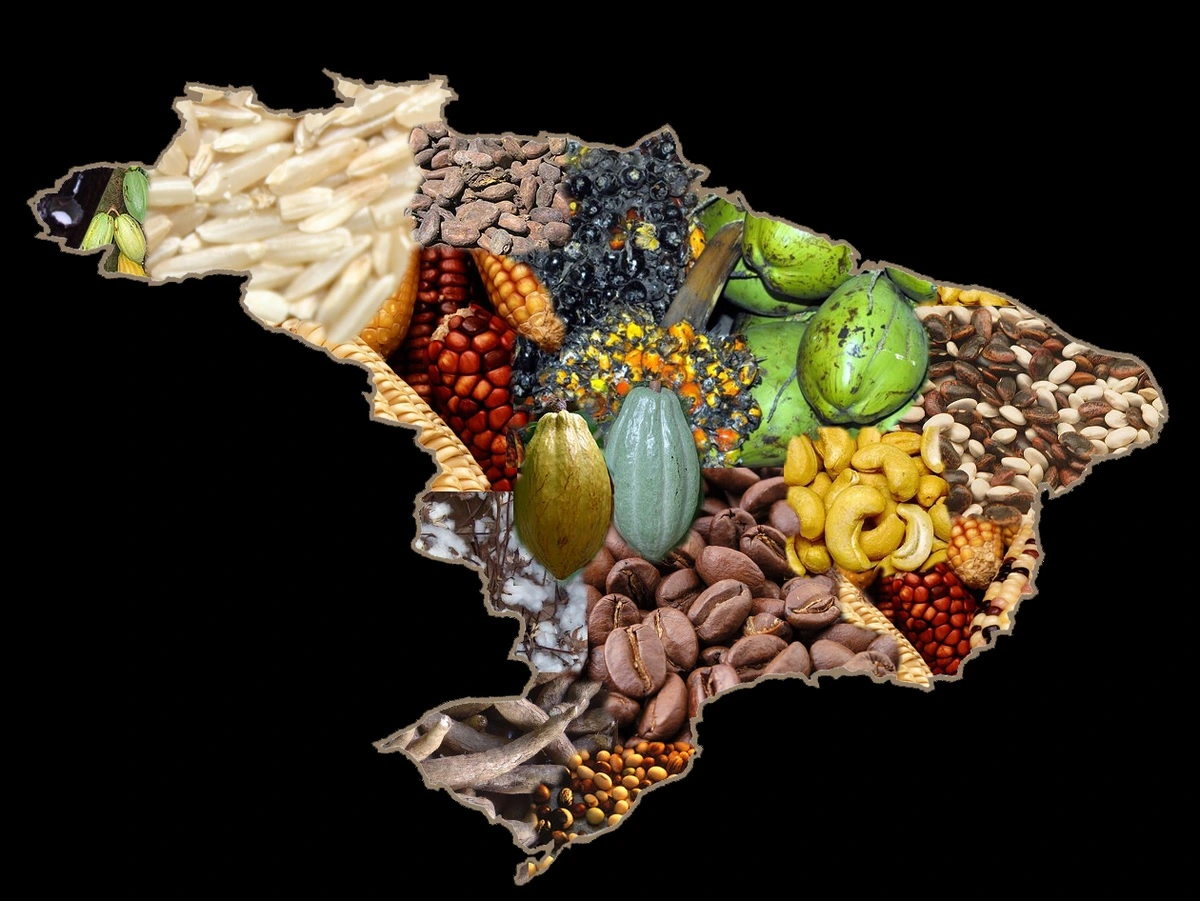
Brazil's Agricultural Output Drops 2.3% Despite Record Grain Harvest.
Brazil’s Agricultural Output Drops 2.3% Despite Record Grain Harvest.
One-stop reference
Company Intelligence
Every listed company in Latin America — financials, ownership and structure for 1,450+ companies across 26 exchanges, in one place.
Browse the directory →
RT
Ask Rio Times
Latin American markets, currencies and companies.
Open the full Ask Rio Times →

However, corn, coffee, and cotton experienced declines of 26.2%, 15.2%, and 9.0% respectively. These fluctuations reflect the volatile nature of agricultural markets.

Winicius Wagner, the research supervisor, attributed the record grain harvest to improved productivity and consistent area expansion. This trend has persisted for years, with annual growth rates of 4-5%.

Other crops also hit production records. These included peanuts, garlic, melon, and sorghum among temporary crops, and olives, rubber, yerba mate, and grapes among permanent crops.

Brazil’s Agricultural Output Drops 2.3% Despite Record Grain Harvest

Mato Grosso remained Brazil’s agricultural powerhouse, generating R$153.5 billion ($27.17 billion) in production value. However, its share decreased to 18.8% due to lower soybean and corn prices.

São Paulo claimed the second spot with 13.8% of national production value, totaling R$112.5 billion ($19.91 billion). The state saw significant increases in sugarcane and orange production.

Paraná rose to third place, contributing 11.1% of the national production value. This surge was primarily due to recovery in soybean and corn production.

Minas Gerais, Brazil’s leading coffee producer, slipped to fourth place. The state’s production value fell by 7.2% to R$81 billion ($14.34 billion).

This agricultural rollercoaster ride underscores the sector’s resilience and its crucial role in Brazil’s economy. It also highlights the need for sustainable practices to ensure long-term stability.

This article was produced by The Rio Times’ automated newsroom system. How we use AI · Report an error

Read More from The Rio Times

The Rio Times · Power Map
See who really holds power in Latin America
Click to open the Power Map →

Rotate for Best Experience

This report is optimized for landscape viewing. Rotate your phone for the full experience.