Brazilian Cities Ranked: Quality of Life Disparities Unveiled
A recent study by Macroplan consultancy has shed light on the quality of life in Brazil’s 100 largest cities. The research, titled “Municipal Management Challenges 2024,” evaluates public services across the education, health, security, and sanitation sectors.
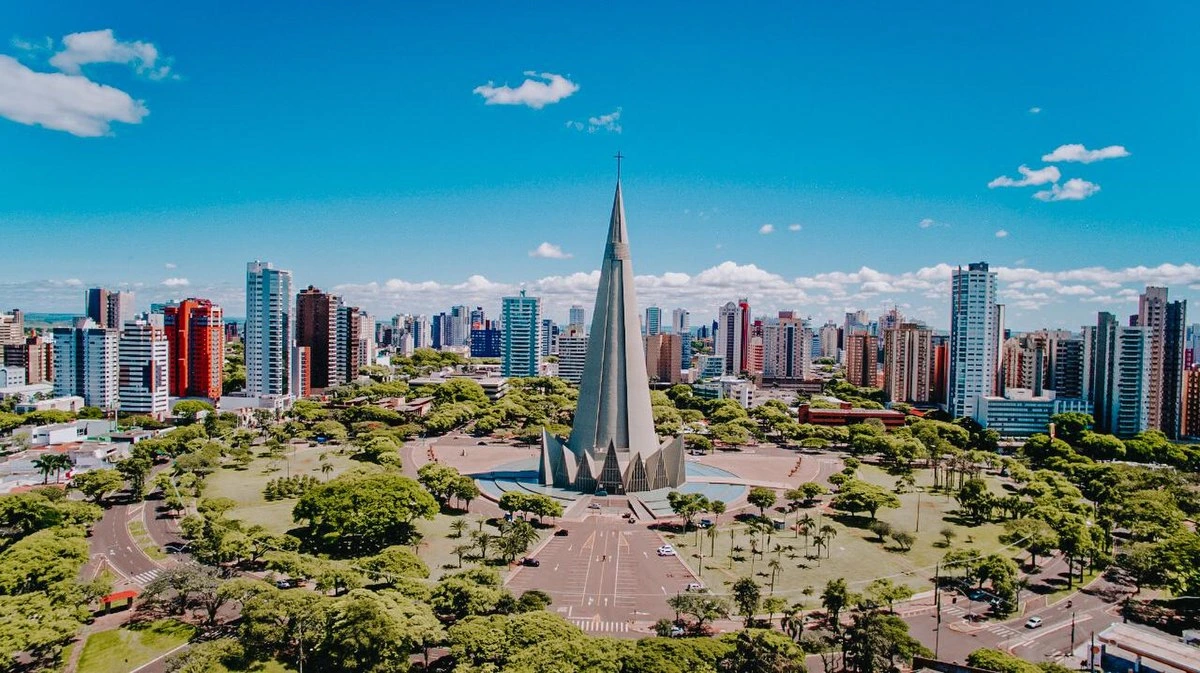
Maringá, located in Paraná State, claimed the top spot in the ranking. Curitiba, also in Paraná, emerged as the highest-ranked capital city, securing fifth place overall.
Rio Branco, the capital of Acre State, found itself at the bottom of the list. These 100 cities, while representing only 1.8% of Brazil’s municipalities, are home to 38.5% of the population.
They generate 44.2% of the country’s GDP, amounting to R$4 trillion ($701.8 billion). The per capita GDP in these urban centers is R$47,500 ($8,333), surpassing the national average by 12.5%.
The study reveals a stark contrast between regions. Cities in the South and Southeast dominate the top 25 positions. Only four cities in the top 50 are outside these regions: Goiânia, Palmas, Campo Grande, and Petrolina.
Conversely, the bottom 25 positions are primarily occupied by cities from the North, Northeast, and Rio de Janeiro metropolitan areas. Half of the ten lowest-ranked cities are in the Rio de Janeiro metropolitan region.
Progress and Challenges
Medium-sized cities, with populations up to 500,000, show notable performance. They occupy three of the top five positions and account for nine of the ten biggest improvements since 2010.
São José dos Pinhais, Paraná, demonstrated the most significant improvement, climbing 42 positions since 2010. It made strides in all four evaluated areas. Cascavel, another city in Paraná, also showed remarkable progress across all sectors.
However, some cities experienced substantial declines. Carapicuíba in São Paulo state dropped 37 positions, with a particularly sharp decline in healthcare. Juazeiro do Norte and Bauru also fell 20 positions each.
The study highlights slow progress in most areas. Only education showed widespread improvement across cities. In health, 20 municipalities worsened or stagnated. Sanitation saw a decline in ten cities, while nine regressed in security.
Despite some advancements, Brazilian cities still lag behind international standards. The infant mortality rate in these 100 cities is more than double the OECD average. The homicide rate is 4.6 times higher than in OECD countries.
This research provides valuable insights for city managers and citizens. It allows for comparison and tracking of progress over time. The data can guide more efficient allocation of public resources and highlight areas needing improvement.
The study underscores the persistent inequality across Brazilian regions. It also emphasizes the need for accelerated progress to reach developed country standards. At the current pace, achieving these benchmarks could take decades rather than years.
Here’s the translated and formatted text list of the complete ranking of the 100 largest cities in Brazil:
1. Maringá, PR – General Index: 0.765 (Δ 2010-2023: +1)
2. Franca, SP – General Index: 0.722 (Δ 2010-2023: +6)
3. Jundiaí, SP – General Index: 0.721 (Δ 2010-2023: +1)
4. Uberlândia, MG General Index: 0.720 (Δ 2010-2023: +6)
5. Curitiba, PR – General Index: 0.718 (Δ 2010-2023: +6)
6. Cascavel, PR – General Index: 0.714 (Δ 2010-2023: +37)
7. São José dos Campos, SP General Index: 0.713 (Δ 2010-2023: -4)
8. Piracicaba, SP – General Index: 0.710 (Δ 2010-2023: -2)
9. São José do Rio Preto, SP General Index: 0.706 (Δ 2010-2023: -8)
10. Barueri, SP – General Index: 0.700 (Δ 2010-2023: +14)
11. Santos, SP – General Index: 0.697 (Δ 2010-2023: +4)
12. Belo Horizonte, MG General Index: 0.696 (Δ 2010-2023: 0)
13. Ribeirão Preto, SP General Index: 0.695 (Δ 2010-2023: -8)
13. São Paulo, SP General Index: 0.695 (Δ 2010-2023: 0)
15. Sorocaba, SP – General Index: 0.694 (Δ 2010-2023: +3)
16. São Bernardo do Campo, SP General Index: 0.692 (Δ 2010-2023: +6)
17. Campinas, SP, General Index: 0.687 (Δ 2010-2023: -8)
18. Londrina, PR – General Index: 0.686 (Δ 2010-2023: -2)
19. São José dos Pinhais, PR – General Index: 0.685 (Δ 2010-2023: +42)
20. Vitória, ES – General Index: 0.683 (Δ 2010-2023: -6)
21. Florianópolis, SC General Index: 0.682 (Δ 2010-2023: -14)
22. Joinville, SC General Index: 0.681 (Δ 2010-2023: +5)
23. Santo André, SP – General Index: 0.680 (Δ 2010-2023: +2)
24. Taubaté, SP – General Index: 0.672 (Δ 2010-2023: +8)
25. Limeira, SP General Index: 0.671 (Δ 2010-2023: -5)
25. Blumenau, SC – General Index: 0.671 (Δ 2010-2023: +3)
27. Goiânia, GO – General Index: 0.663 (Δ 2010-2023: +7)
28. Palmas, TO: General Index: 0.662 (Δ 2010-2023: +2).
28. Montes Claros, MG General Index: 0.662 (Δ 2010-2023: -9)
30. Diadema, SP – General Index: 0.658 (Δ 2010-2023: +3)
31. Sumaré, SP – General Index: 0.653 (Δ 2010-2023: -10)
32. Praia Grande, SP General Index: 0.652 (Δ 2010-2023: +5)
32. Suzano, SP – General Index: 0.652 (Δ 2010-2023: -3)
34. Contagem, MG General Index: 0.646 (Δ 2010-2023: +4)
34. Mauá, SP – General Index: 0.646 (Δ 2010-2023: +16)
36. Rio de Janeiro, RJ – General Index: 0.645 (Δ 2010-2023: +12)
36. Foz do Iguaçu, PR – General Index: 0.645 (Δ 2010-2023: +13)
36. Ponta Grossa, PR – General Index: 0.645 (Δ 2010-2023: +2)
39. Uberaba, MG General Index: 0.644 (Δ 2010-2023: -23)
39. Caxias do Sul, RS, General Index: 0.644 (Δ 2010-2023: +5)
41. Taboão da Serra, SP – General Index: 0.640 (Δ 2010-2023: -5)
42. Bauru, SP – General Index: 0.638 (Δ 2010-2023: -20)
43. Mogi das Cruzes, SP General Index: 0.637 (Δ 2010-2023: -2)
44. Niterói, RJ – General Index: 0.636 (Δ 2010-2023: -18)
45. Betim, MG – General Index: 0.631 (Δ 2010-2023: -14)
46. Vila Velha, ES – General Index: 0.630 (Δ 2010-2023: +8)
46. Campo Grande, MS – General Index: 0.630 (Δ 2010-2023: -1)
48. Porto Alegre, RS: General Index: 0.628 (Δ 2010-2023: -2).
49. Petrolina, PE – General Index: 0.622 (Δ 2010-2023: +23)
50. Petrópolis, RJ – General Index: 0.620 (Δ 2010-2023: +6)
51. Fortaleza, CE – General Index: 0.606 (Δ 2010-2023: +1)
52. Osasco, SP – General Index: 0.605 (Δ 2010-2023: -10)
53. Campina Grande, PB, General Index: 0.603 (Δ 2010-2023: +6)
53. Serra, ES – General Index: 0.603 (Δ 2010-2023: +13)
55. Ribeirão das Neves, MG General Index: 0.600 (Δ 2010-2023: -2)
56. Cuiabá, MT – General Index: 0.596 (Δ 2010-2023: +6)
57. Guarulhos, SP General Index: 0.593 (Δ 2010-2023: -10)
58. Juiz de Fora, MG General Index: 0.589 (Δ 2010-2023: -18)
59. Anápolis, GO – General Index: 0.585 (Δ 2010-2023: +9)
60. São Vicente, SP General Index: 0.583 (Δ 2010-2023: +4)
61. Boa Vista, RR: General Index: 0.582 (Δ 2010-2023: -1).
62. Caucaia, CE – General Index: 0.581 (Δ 2010-2023: -11)
62. Cotia, SP – General Index: 0.581 (Δ 2010-2023: -7)
64. Recife, PE – General Index: 0.579 (Δ 2010-2023: +4)
65. João Pessoa, PB, General Index: 0.577 (Δ 2010-2023: -1).
65. Itaquaquecetuba, SP – General Index: 0.577 (Δ 2010-2023: -7)
67. Vitória da Conquista, BA, General Index: 0.576 (Δ 2010-2023: +26)
68. Pelotas, RS, General Index: 0.575 (Δ 2010-2023: +8)
69. Caruaru, PE – General Index: 0.573 (Δ 2010-2023: +13)
70. Canoas, RS: General Index: 0.570 (Δ 2010-2023: +5)
71. Guarujá, SP – General Index: 0.568 (Δ 2010-2023: +2)
72. Carapicuíba, SP – General Index: 0.563 (Δ 2010-2023: -37)
73. Natal, RN, General Index: 0.562 (Δ 2010-2023: -11)
74. Teresina, PI, General Index: 0.561 (Δ 2010-2023: -7)
75. Aracaju, SE – General Index: 0.560 (Δ 2010-2023: +1)
76. Aparecida de Goiânia, GO – General Index: 0.553 (Δ 2010-2023: +9)
77. Juazeiro do Norte, CE General Index: 0.552 (Δ 2010-2023: -20)
78. Salvador, BA, General Index: 0.545 (Δ 2010-2023: 0)
79. Cariacica, ES, General Index: 0.541 (Δ 2010-2023: +9)
80. Paulista, PE – General Index: 0.536 (Δ 2010-2023: +4)
81. São Luís, MA – General Index: 0.530 (Δ 2010-2023: -10)
82. Campos dos Goytacazes, RJ, General Index: 0.527 (Δ 2010-2023: -9)
83. Olinda, PE – General Index: 0.526 (Δ 2010-2023: +4)
84. Várzea Grande, MT – General Index: 0.521 (Δ 2010-2023: +7)
85. Manaus, AM – General Index: 0.518 (Δ 2010-2023: -15)
86. Camaçari, BA, General Index: 0.511 (Δ 2010-2023: +3)
87. Feira de Santana, BA, General Index: 0.504 (Δ 2010-2023: -7)
88. Ananindeua, PA – General Index: 0.499 (Δ 2010-2023: -11)
89. Belford Roxo, RJ, General Index: 0.487 (Δ 2010-2023: -5)
90. Maceió, AL – General Index: 0.480 (Δ 2010-2023: -6)
91. Belém, PA – General Index: 0.475 (Δ 2010-2023: -7)
92. Macapá, AP, General Index: 0.473 (Δ 2010-2023: -6)
93. Duque de Caxias, RJ, General Index: 0.472 (Δ 2010-2023: -3)
94. Serra Talhada, PE – General Index: 0.465 (Δ 2010-2023: +10)
95. São João de Meriti, RJ – General Index: 0.464 (Δ 2010-2023: -1)
96. Jaboatão dos Guararapes, PE – General Index: 0.463 (Δ 2010-2023: +3)
97. Porto Velho, RO – General Index: 0.459 (Δ 2010-2023: +7)
98. Serra, ES – General Index: 0.458 (Δ 2010-2023: +4)
99. Mesquita, RJ – General Index: 0.457 (Δ 2010-2023: -2)
100. Rio Branco, AC General Index: 0.455 (Δ 2010-2023: +8)
More: Brazil news in English, every day from The Rio Times.
This article was drafted with automated assistance and reviewed before publication. How we use AI · Report an error
Read More from The Rio Times